2019-5-30 15:30 |
Both XRP and XLM recorded significant gains on the cryptocurrency charts yesterday. The larger market was doing well on the back of EOS’s surge yesterday, and Bitcoin SV’s fantastic hike today.
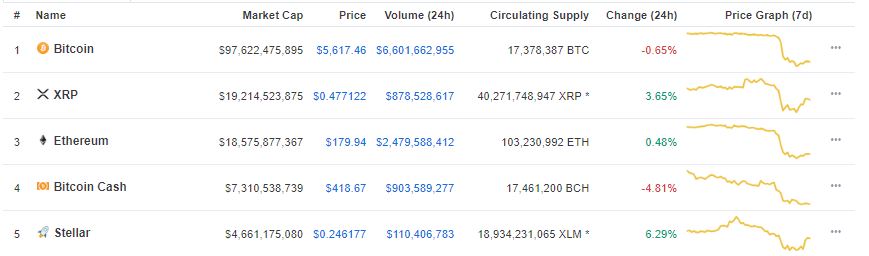
1 Day XRP chart
Source: TradingView
The 24-hour trading volume for XRP $2.90 billion, with its market cap recorded at over $19 billion. XRP was priced at $0.459, at press time.
An uptrend was seen from $0.2983 to $0.3201, while a downtrend extended from $0.5507 to $0.4615. Resistance stood at $0.5076, while support was at $0.2856.
Bollinger Bands signified squeezing volatility, after an extended phase of expanding volatility.
Aroon’s up-line and down-line were seen falling, indicating sideways trend in the market.
Awesome Oscillator pointed towards a bullish buying opportunity.
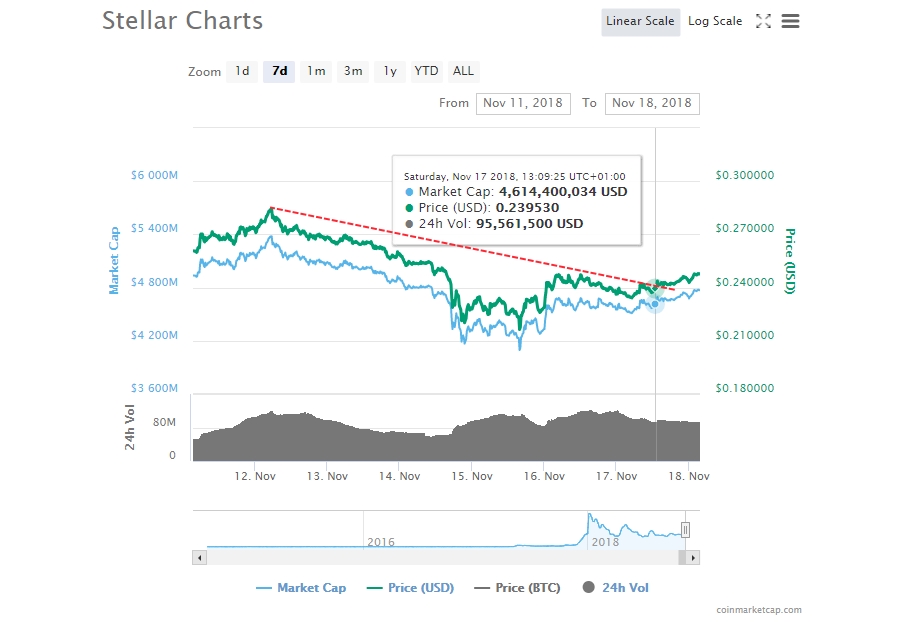
1 Day XLM chart
Source: TradingView
XLM was at the 10th position on CoinMarketCap and had a 24-hour trading volume of over $550 million. Its market cap was $2.72 billion, at press time.
An uptrend was seen from $0.0809 to $0.1013, and downtrend was recorded from $0.2765 to $0.1438. Resistance was seen at $0.2492 and support at $0.0739.
Parabolic SAR pointed towards a bearish market as the dotted markers were seen above the candles.
Relative Strength Index signified buying pressure in the market as the graph was seen above the fifty mark.
Chaikin Money Flow indicated money inflow in the market, as the CMF line was above zero.
Conclusion
After a few days of consolidated gains, both XRP and XLM had settled into sideways movement, with indicators on their charts giving both bullish and bearish signals.
The post XRP v. Stellar Lumens [XLM] Price Analysis: Coins settle into sideways movement appeared first on AMBCrypto.
origin »Bitcoin price in Telegram @btc_price_every_hour
Ripple (XRP) на Currencies.ru
|
|