2020-12-23 14:30 |
XRP has decreased by nearly 50% since reaching a 2020 high of $0.79 on Nov. 24.
Despite the drop, XRP is approaching crucial support levels which are likely to provide a bounce and possibly reverse the bearish trend.
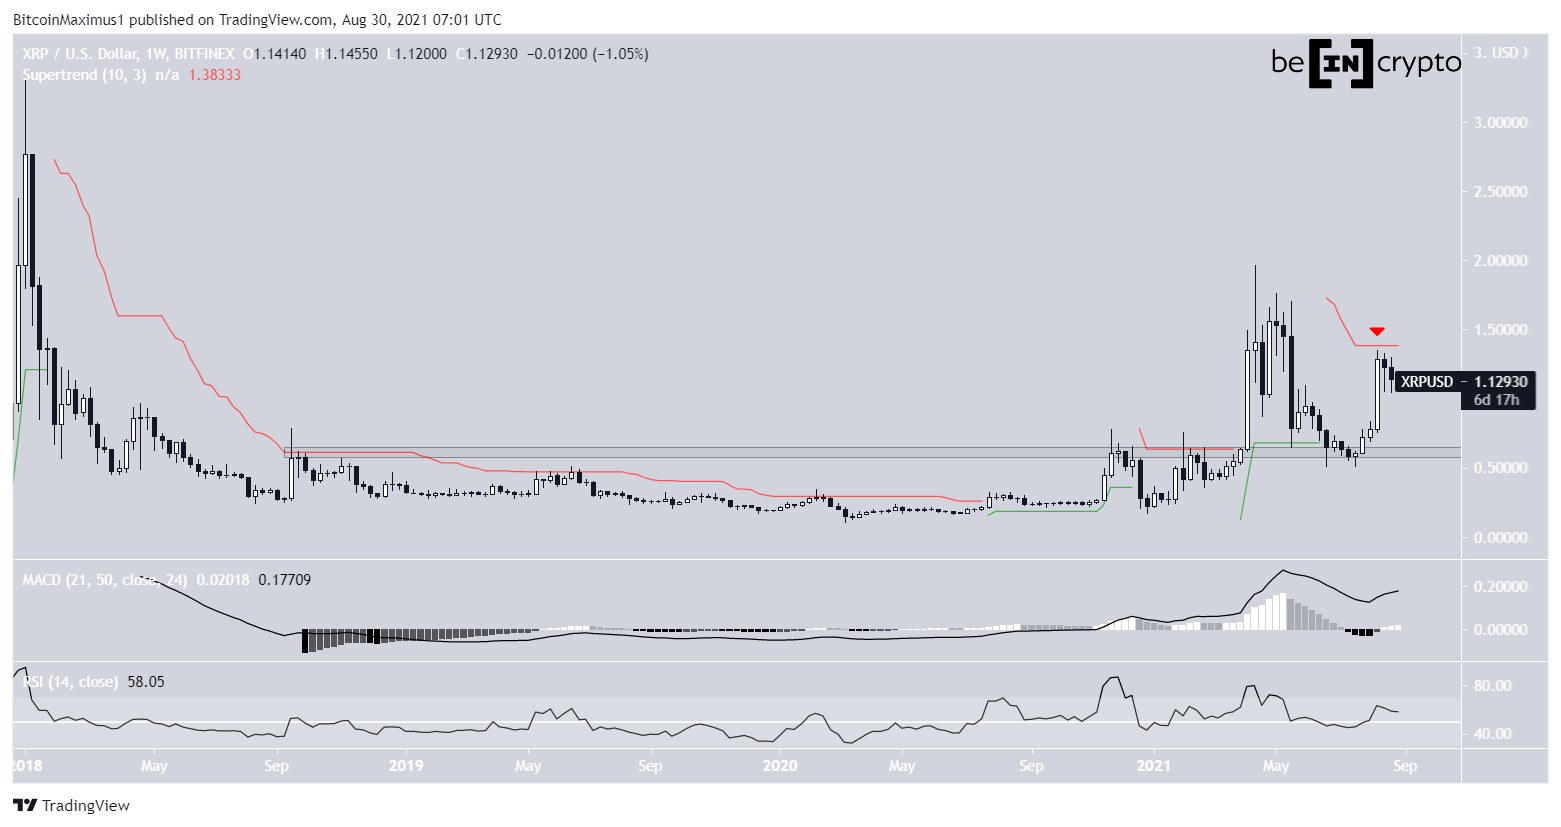
XRP Long-Term MovementAt the time XRP was making its 2020 high, the main long-term resistance level was found at $0.75 and there was support at $0.50.
However, XRP has broken down from the support and is rapidly approaching the $0.32 long-term support area. XRP initially broke out from this level at the beginning of November.
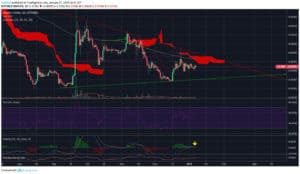
Technical indicators are leaning on being bearish. The RSI has fallen sharply, the MACD is in the process of generating its first lower momentum bar, and the Stochastic oscillator has just made a bearish cross.
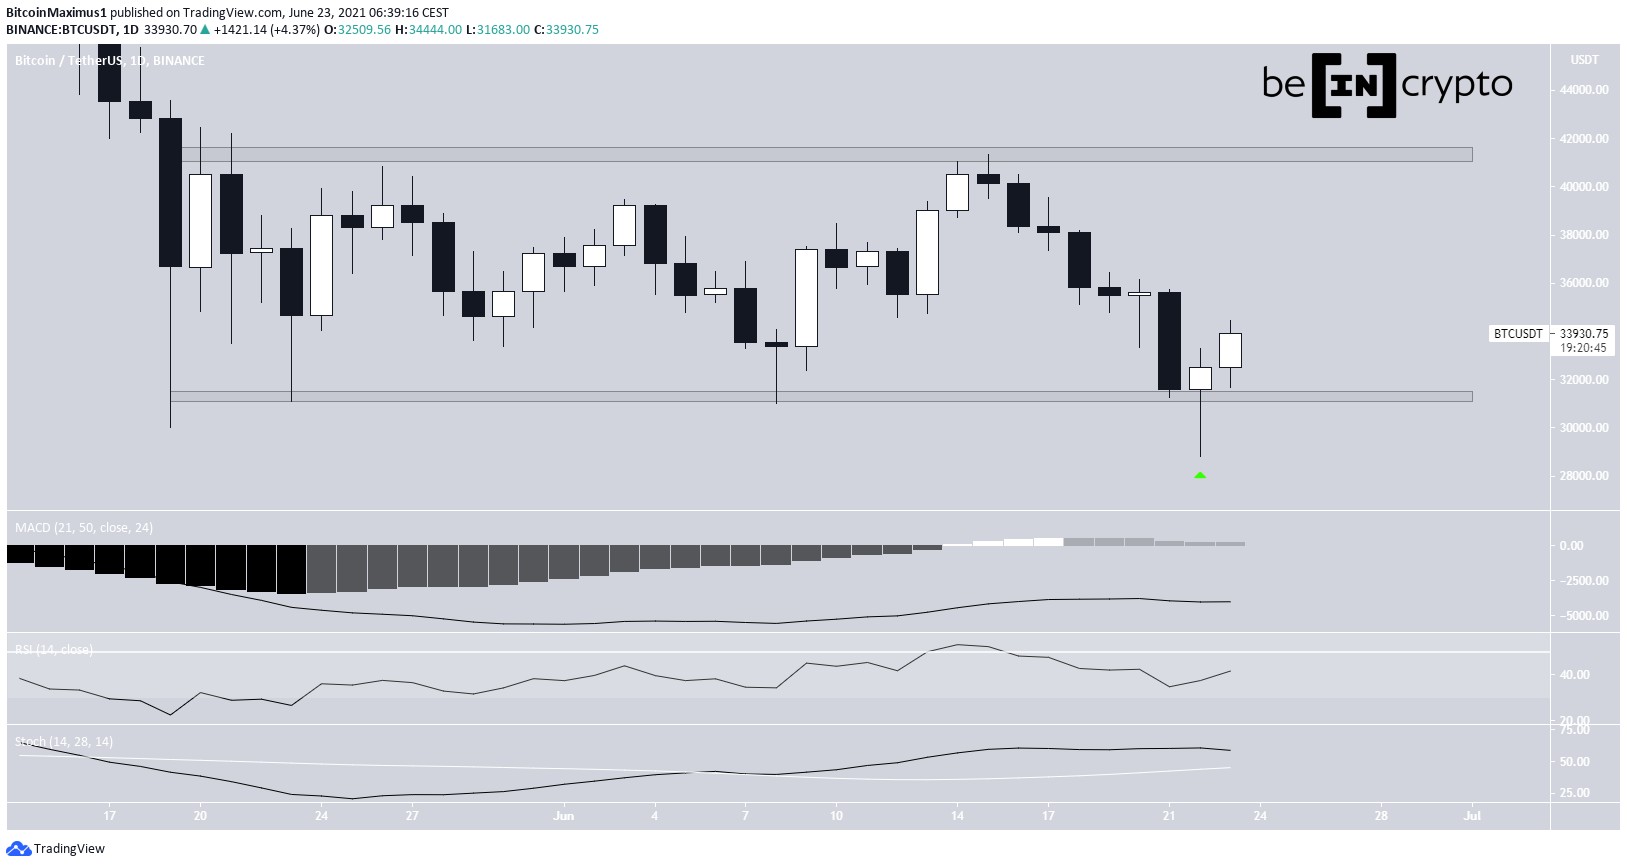
XRP Chart By TradingView Support LevelsThe daily chart shows that XRP has been following a very long-term ascending support line since reaching its lows in March.
In addition, there are two important support areas at $0.325 and $0.29. The ascending support line coincides with the $0.29 support.
Similar to the weekly time-frame, there are no bullish reversal signs present.
XRP Chart By TradingViewWhile the two-hour chart shows some bullish divergence in the RSI, the MACD is rapidly decreasing.
Therefore, while XRP is approaching numerous strong support levels, there are no bullish reversal signs yet.
XRP Chart By TradingView Wave CountCryptocurrency trader @thetradinghubb outlined an XRP chart, stating that it will likely decrease towards the low $0.30s before moving back up.
Source: TwitterThe most likely wave count suggests that it has completed wave 1 (shown in white) which began with the lows in March. The sub-wave count is shown in orange.
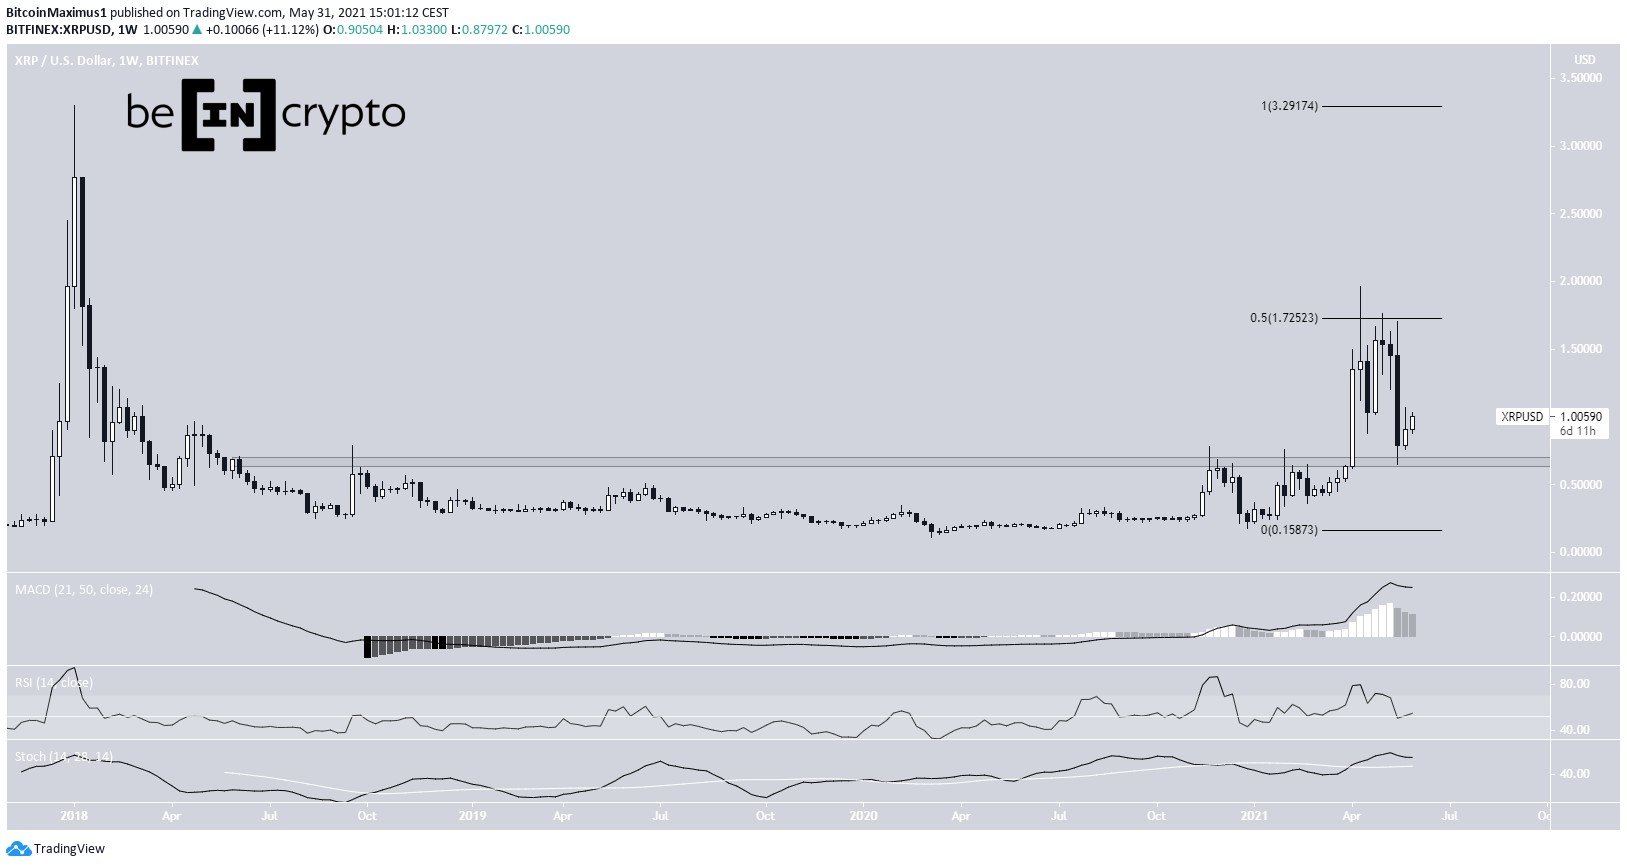
Currently, the price is at the 0.618 Fib retracement level, a likely place for the downward move to end. This scenario is also strengthened by the numerous support levels just below the current price.
XRP Chart By TradingViewFurthermore, the sub-wave count for the possible corrective wave 2 suggests that the correction is nearing its end. This is due to the 1:1 ratio found between waves 1 and 2.
XRP Chart By TradingView ConclusionThe XRP price is expected to reverse its trend soon and eventually make an attempt at breaking out above the $0.50 area. While it is still likely that the long-term trend is bullish, that cannot be confirmed until it breaks out above $0.50.
For BeInCrypto’s latest Bitcoin (BTC) analysis, click here!
Disclaimer: Cryptocurrency trading carries a high level of risk and may not be suitable for all investors. The views expressed in this article do not reflect those of BeInCrypto.
The post XRP Crashes Back to $0.30 Amid 30% Daily Drop appeared first on BeInCrypto.
origin »Bitcoin price in Telegram @btc_price_every_hour
Ripple (XRP) на Currencies.ru
|
|