2021-6-23 11:25 |
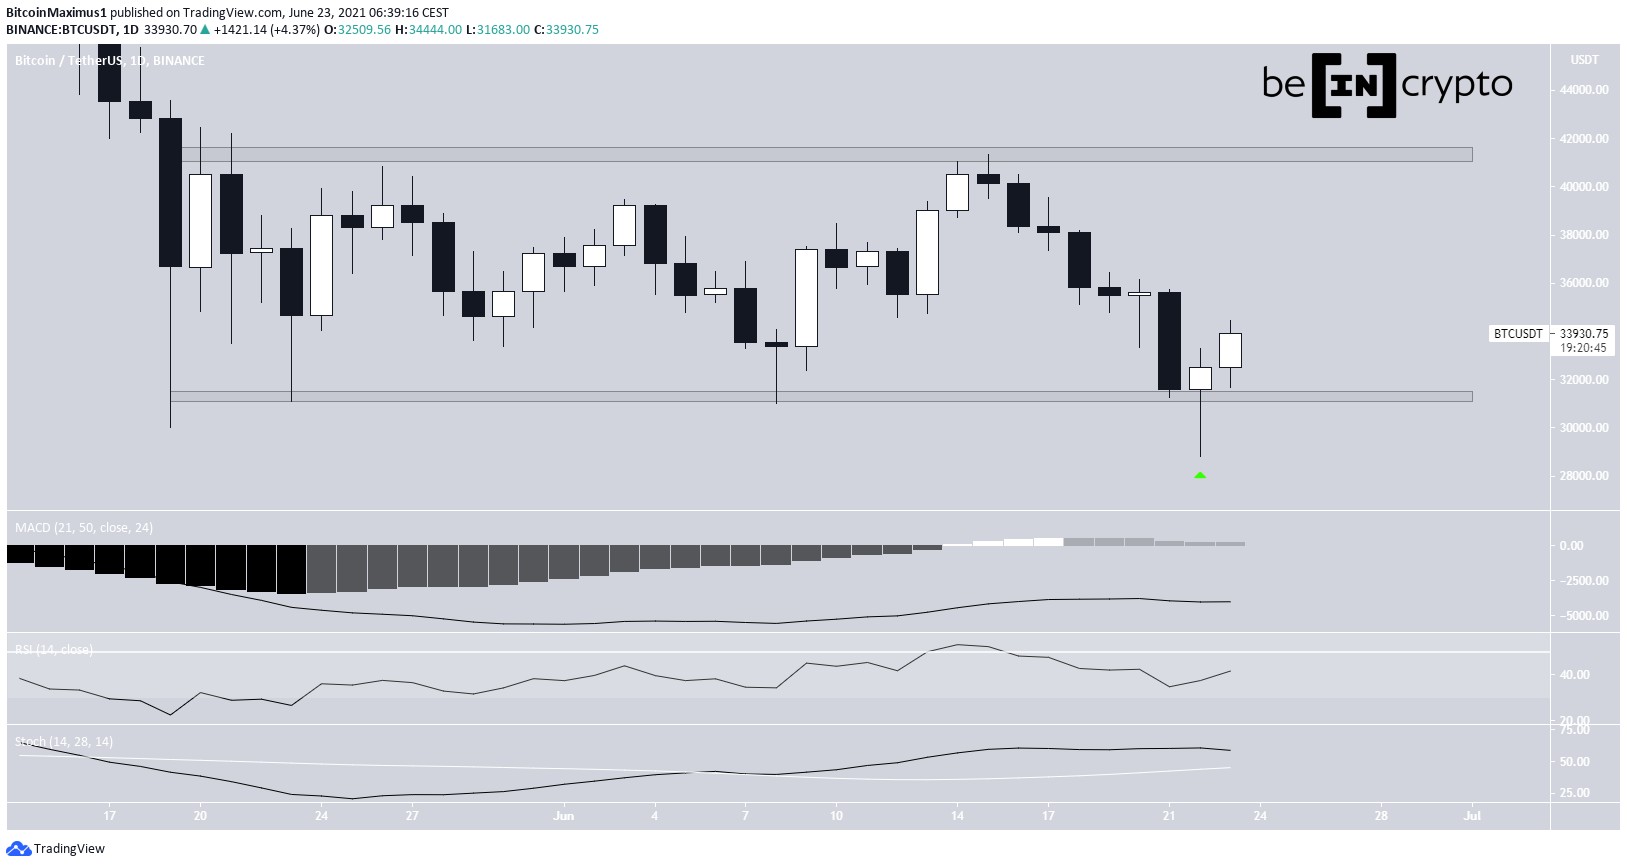
Bitcoin (BTC) and ethereum (ETH) have created bullish hammer candlesticks.
XRP (XRP), Hedera Hashgraph (HBAR) and Chiliz (CHZ) are trading inside descending parallel channels.
Monero (XMR) has broken down from a symmetrical triangle.
Helium (HNT) has crated a triple bottom pattern.
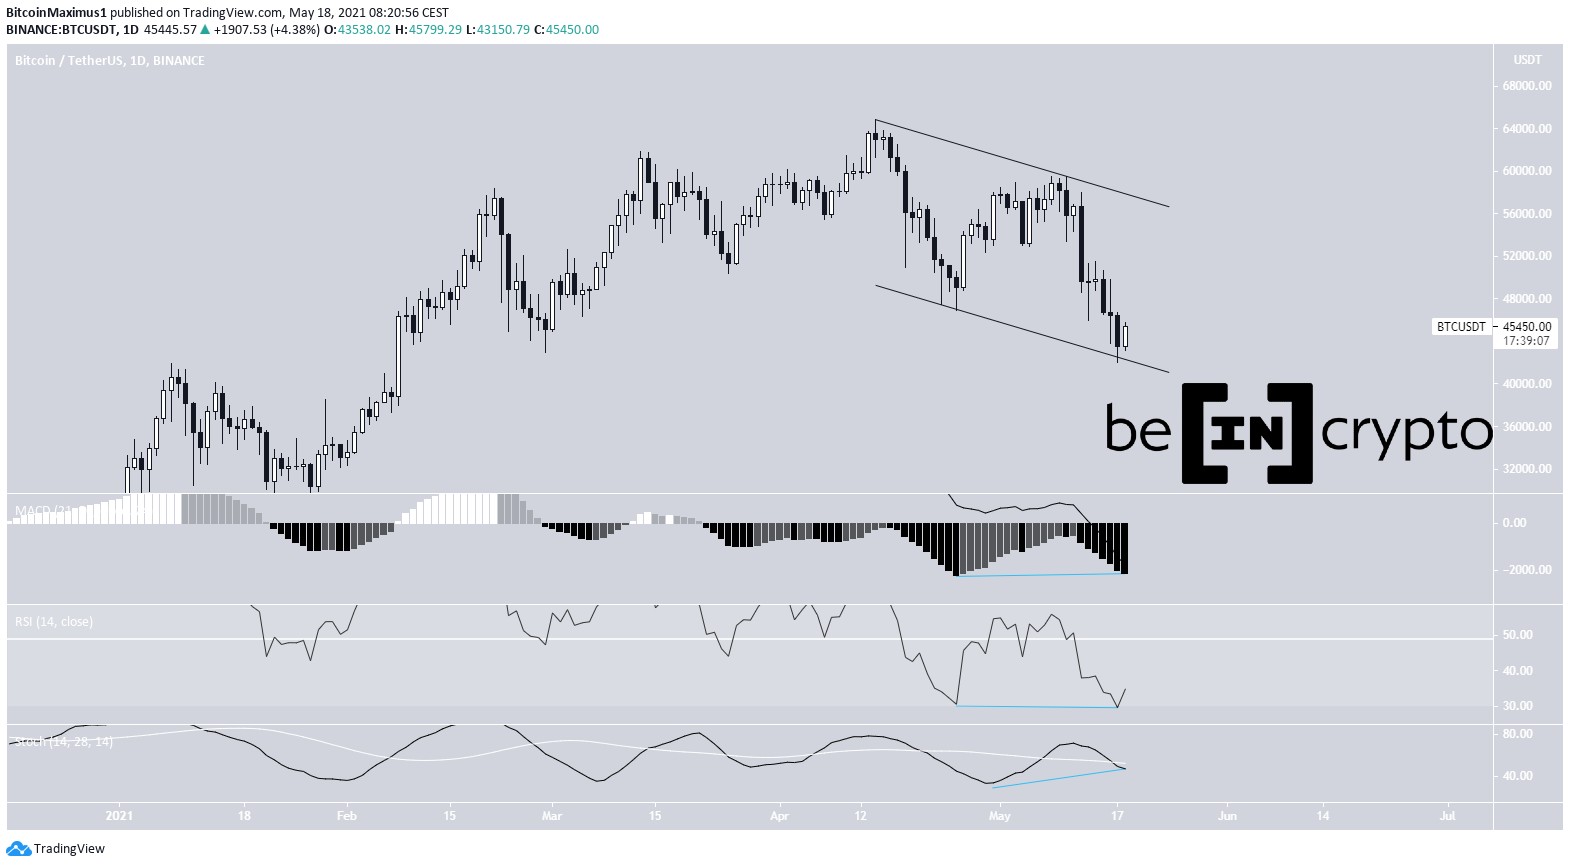
BTCBTC decreased considerably yesterday, falling to a low of $28,805. However, it bounced almost immediately afterwards and created a bullish hammer candlestick. Afterwards, it reclaimed the $31,300 horizontal support area.
Despite the bounce, technical indicators are still bearish. The RSI is below 50, the MACD signal line is still negative, while the Stochastic oscillator has yet to rally.
The next closest resistance area is found at $41,500. It is possible that the decrease marked the bottom of wave five.
Chart By TradingView
ETHETH has been decreasing since reaching a high of $2,912 on May 26. Yesterday, it reached a low of $1,700, before bouncing. Similarly to BTC, it created a bullish hammer candlestick.
The downward movement does not look impulsive at all (highlighted in red). Therefore, it is likely that it is only part of the B wave of an A-B-C corrective structure.
In that case, ETH is now in the C wave, which is likely to continue until potentially the 0.5 Fib retracement resistance level at $3,058.
Chart By TradingView
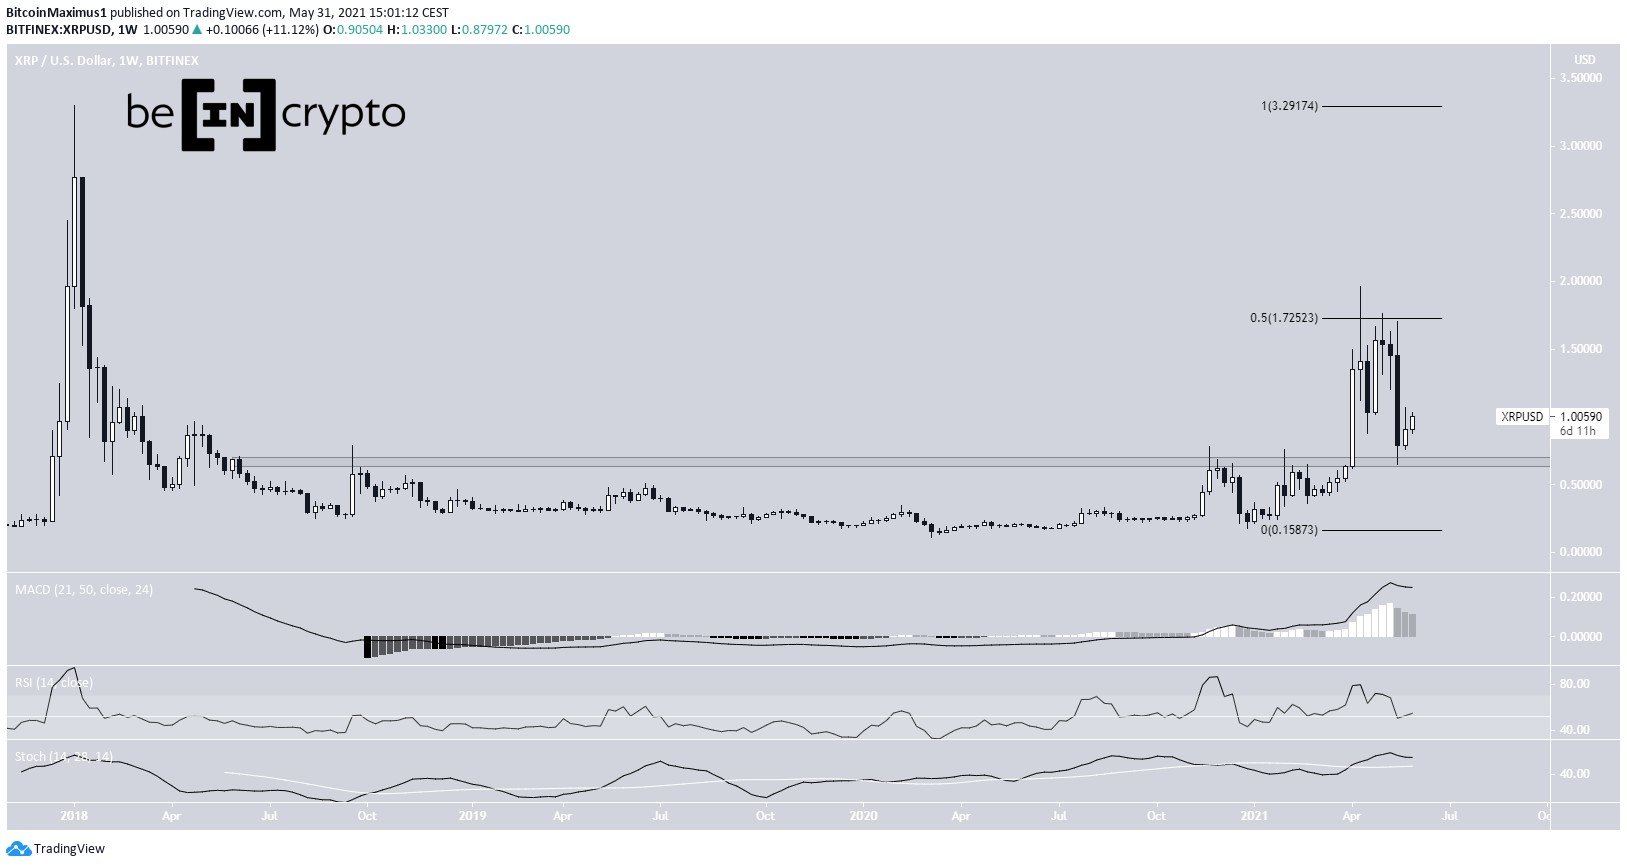
XRPXRP reached a low of $0.50 on June 22, before moving upwards. The low was made at the $0.60 horizontal support area and the support line of a descending parallel channel, which has been in place since April 13.
XRP is currently in the process of creating a bullish engulfing candlestick. The closest resistance area is at $0.79.
Chart By TradingView
CHZCHZ has been trading inside a descending parallel channel since reaching an all-time high price on March 12. It bounced on its support line twice, on May 19 and March 23.
After a failed upward movement, CHZ returned to the $0.205 support area once more, on June 22. This created a triple bottom pattern, which was combined with bullish divergence in the MACD, RSI and Stochastic oscillator (blue lines).
Therefore, an upward movement towards the middle of the channel would be likely, and potentially towards the top of the channel.
Chart By TradingView
HBARHBAR has been decreasing alongside a descending parallel channel since March 14.
On June 22, it bounced at the support line of this channel and the $0.155 support area, creating a long lower wick in the process.
However, unlike CHZ, technical indicators do not seem completely bullish. The MACD histogram has generated bullish divergence, but both the RSI and Stochastic oscillator are bearish.
Nevertheless, the price action seems bullish, so an upward movement towards the middle of the channel could occur.
Chart By TradingView
XMRXMR had been trading inside a symmetrical triangle since May 21. On June 21, it broke down from the triangle and proceeded to reach a low of $180 the next day.
XMR bounced afterwards and has created a higher low. However, until it reclaims the $240 resistance area and the support line of the triangle, the trend cannot be considered bullish.
Chart By TradingView
HNTHNT has been decreasing alongside a descending resistance line since May 28. On June 22, it reached a low of $8.80, creating a triple bottom pattern relative to the price on May 19 and May 23.
Afterwards, it bounced and broke out from the previously mentioned descending resistance line. The next closest resistance area is at $14.50, the 0.382 Fib retracement resistance level.
Chart By TradingView
For BeInCrypto’s latest bitcoin (BTC) analysis, click here.
The post BTC, ETH, XRP, CHZ, HBAR, XMR, HNT — Tech Analysis, June 23 appeared first on BeInCrypto.
origin »Bitcoin price in Telegram @btc_price_every_hour
Bitcoin (BTC) на Currencies.ru
|
|


