2020-7-15 18:39 |
The XRP (XRP) price has been increasing at an accelerated rate since it broke out from a descending resistance line on July 6.
BreakoutThe XRP price moved upwards in the period from March 13 to April 30. However, it reached a high of $0.236 towards the end of that period and has been declining since.
The price created a descending resistance line on June 2, that was in place for 34 days. After dropping to the 0.5 Fib level and bouncing, the XRP price broke out from the descending resistance line and has been increasing at an accelerated pace. During this time, the daily RSI crossed above 50, a bullish sign.
However, the price is still facing resistance from its 200-day moving average (MA), which also halted the upward move during the previous April 30 high. Therefore, until the price successfully flips this MA as support, we cannot consider the price movement bullish.
XRP Chart By TradingviewA look at the shorter-term move shows that the rally stalled on July 10, when the price reached a high of $0.211 and has been declining since.
For the rally to continue, the price would have to ideally hold the $0.185 support area, which is both the 0.618 Fib level and previous support.
XRP Chart By Tradingview XRP Wave CountCryptocurrency trader @davecrypto83 outlined a XRP chart that shows that the price is still correcting. He predicts an increase towards $0.4, before the price continues its downward movement towards $0.08.
Source: TwitterWhile it definitely looks like the price is currently completing an upwards A-B-C, an alternative wave count would suggest that the price has completed B and is in the process of moving towards C. This would be confirmed by a rally above $0.225, which is the top of wave A.
The resulting move would likely extend towards $0.4, as outlined in the tweet.
XRP Chart By TradingviewFor this wave count to be correct, the price would have to hold the current ascending parallel channel, from which it has broken out. A decline below $0.179 (the support line of the channel and top of sub-wave 1) would invalidate the current wave count.
In that case, the alternate wave count outlined in the tweet would likely happen.
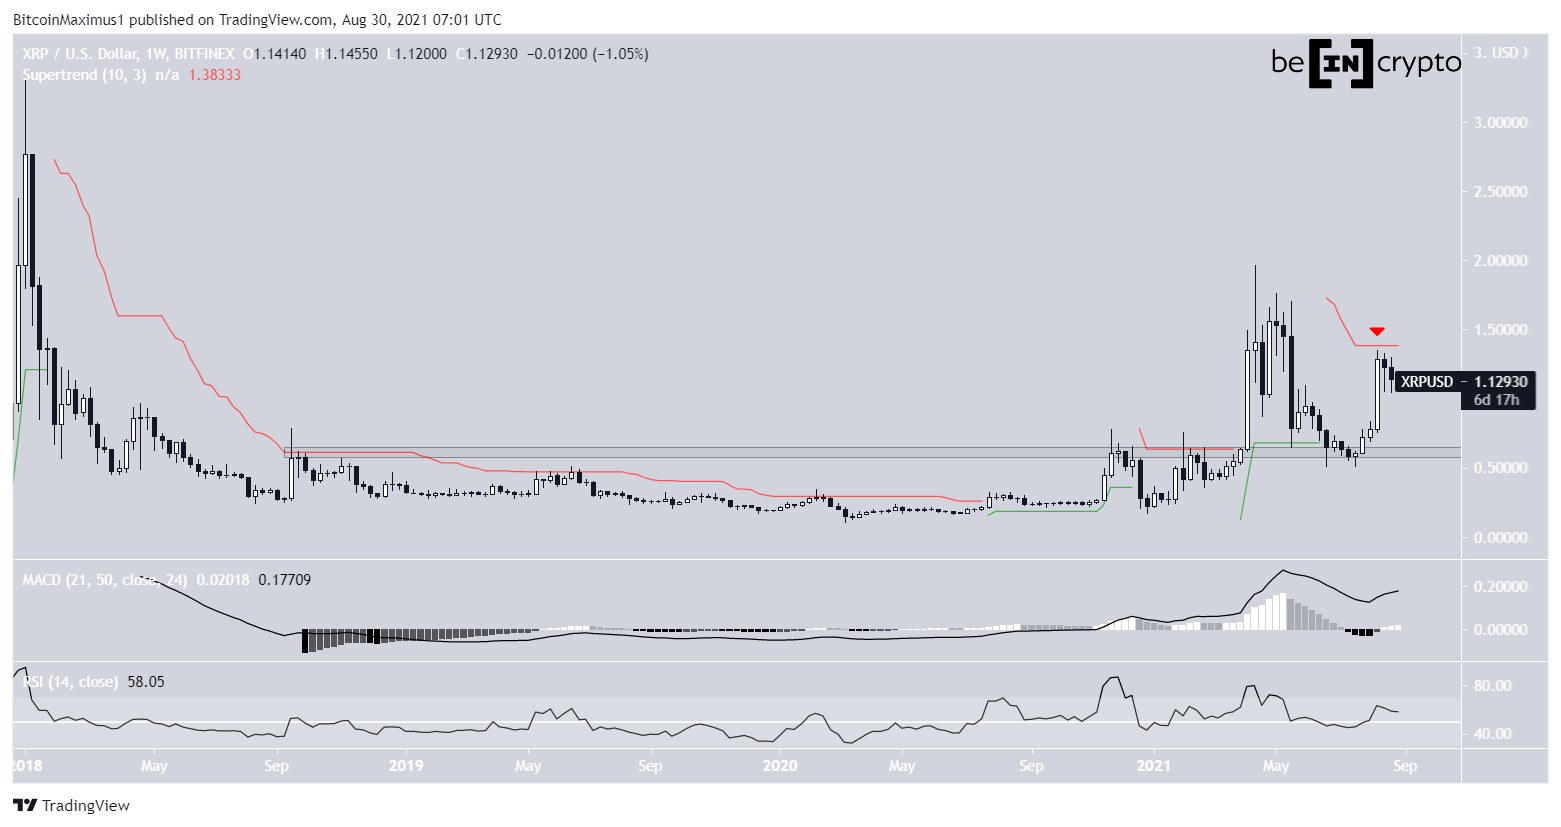
XRP Chart By TradingviewTo conclude, the XRP price has broken out from a descending resistance line and should continue moving upwards after a short-term retracement.
The post XRP Begins Upward Move After Breaking Out From Resistance appeared first on BeInCrypto.
origin »Bitcoin price in Telegram @btc_price_every_hour
Ripple (XRP) на Currencies.ru
|
|