2020-10-14 23:11 |
The Total Cryptocurrency Market Cap (TOTALCAP) has been increasing since it created a bullish reversal pattern inside a significant support level.
Similarly, the Altcoin Market Cap (ALTCAP) has broken out from a descending resistance line.
Double BottomTOTALCAP has been increasing since it created a double bottom pattern inside the $310 billion support area throughout September. At the time of writing, it has just moved above the 0.618 Fib level of the entire downward move.
Since this is a very common retracement level for corrections, a continued rally above would likely mean that the current increase is a new upward move rather than a correction.
Technical indicators are bullish, since all three of the: MACD, RSI, and Stochastic Oscillator are increasing, the latter having made a bullish cross.
If the cap continues rallying, the closest resistance area would be found at $390 billion, coinciding with the August highs.
Cryptocurrency Market Cap Chart By TradingViewThe shorter-term chart shows a breakout above a descending resistance line (dashed) and a re-test of the previous resistance area as support. While this is a bullish development, technical indicators are bearish, showing weakness in the form of bearish divergence in the RSI and MACD.
This indicates that a decline towards the closest support area at $346 billion could occur. If the price manages to hold above, the possibility of upwards continuation is high.
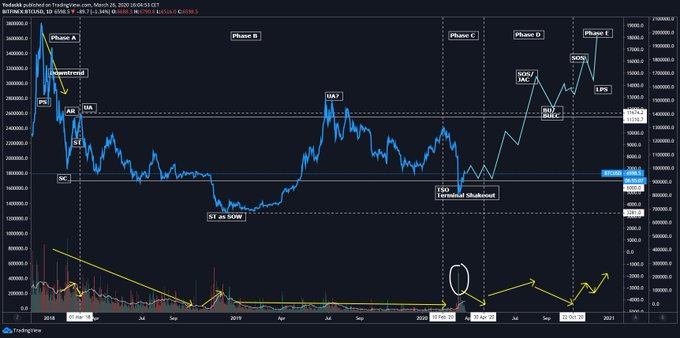
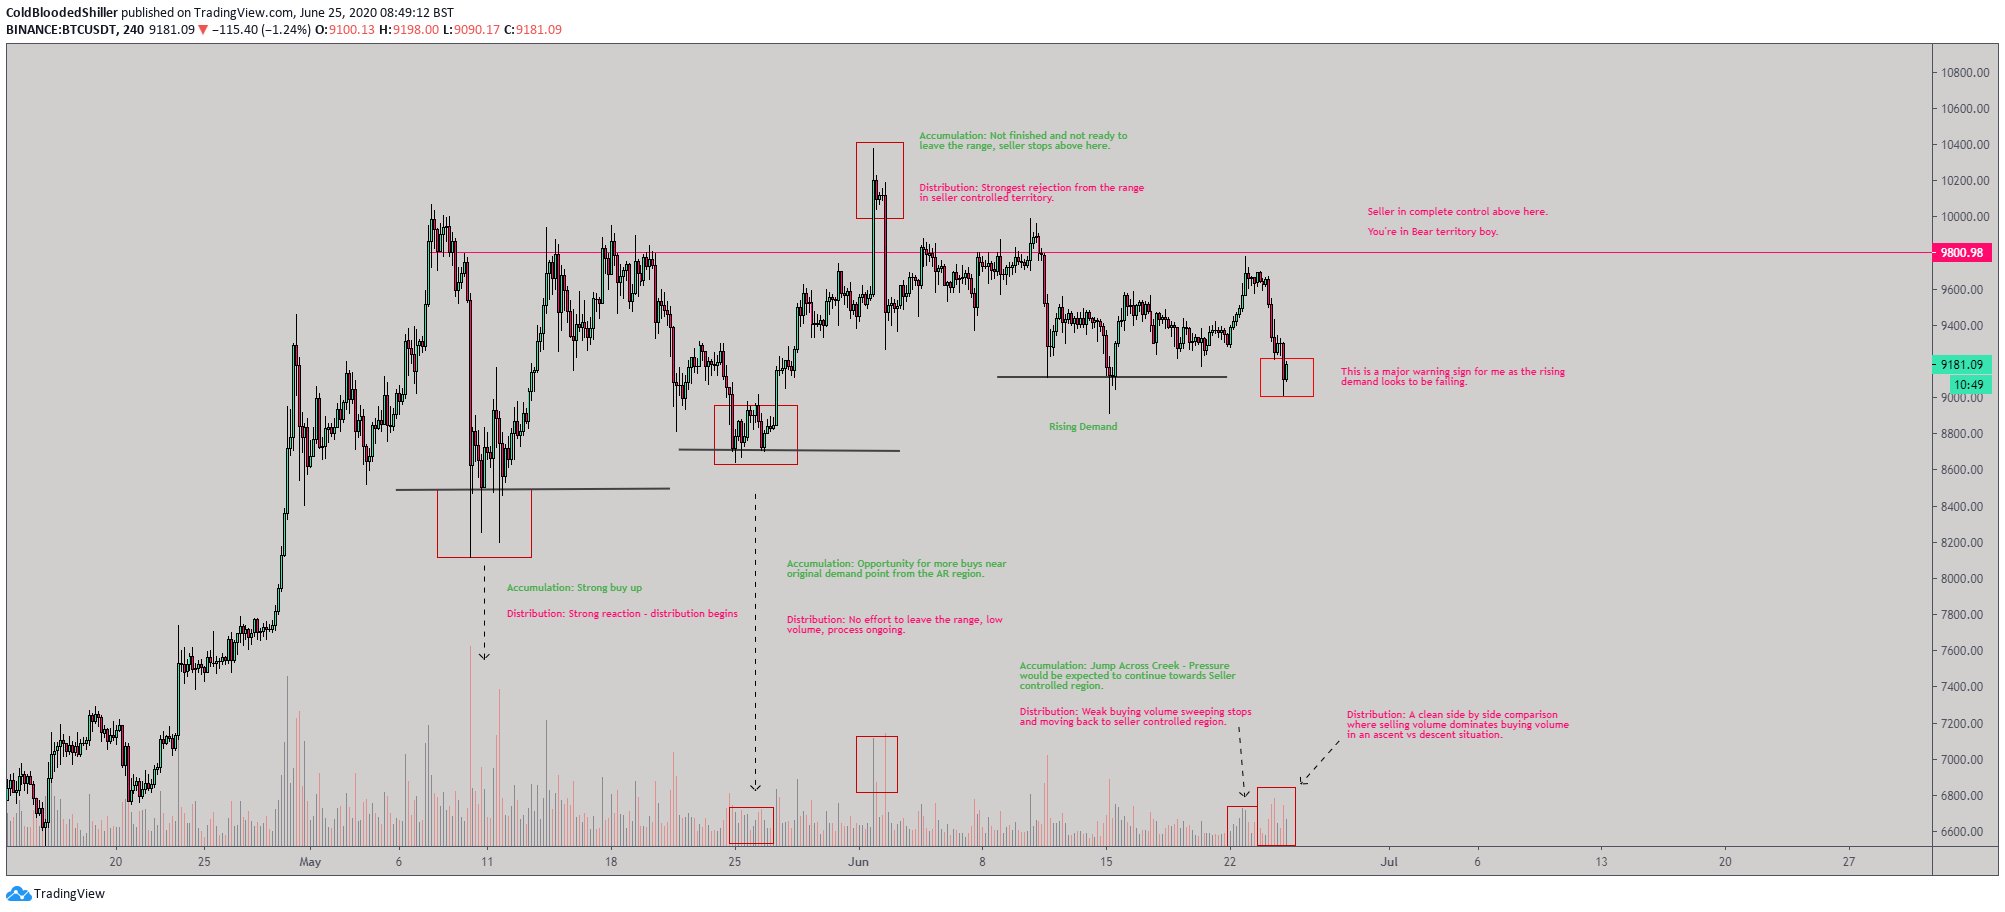
Cryptocurrency Market Cap Chart By TradingView TOTALCAP’s Long-Term ResistanceCryptocurrency trader @AltcoinSherpa outlined a total market cap chart that predicts a rally in the month of Dec.
Source: TwitterThe weekly chart shows a similar re-test of the previous resistance area as support.
Furthermore, if the cap continues increasing, the next resistance levels would be $425 and $617 billion, respectively.
Cryptocurrency Market Cap Chart By TradingView Altcoin Market CapThe ALTCAP has similar price action to the TOTALCAP, but it has already broken out from a descending resistance line.
However, it’s struggling to move above the $144 billion area, which is acting as resistance. A successful breakout would likely lead the cap towards $162 billion.
However, a fall to re-test the previous resistance line and the $130 billion support area before moving upwards seems the more probable movement.
ALTCAP Chart By TradingViewFor BeInCrypto’s Bitcoin analysis, click here!
Disclaimer: Cryptocurrency trading carries a high level of risk and may not be suitable for all investors. The views expressed in this article do not reflect those of BeInCrypto.
The post TOTALCAP Continues Ascent After Creating Bullish Pattern appeared first on BeInCrypto.
origin »BottleCaps (CAP) на Currencies.ru
|
|

