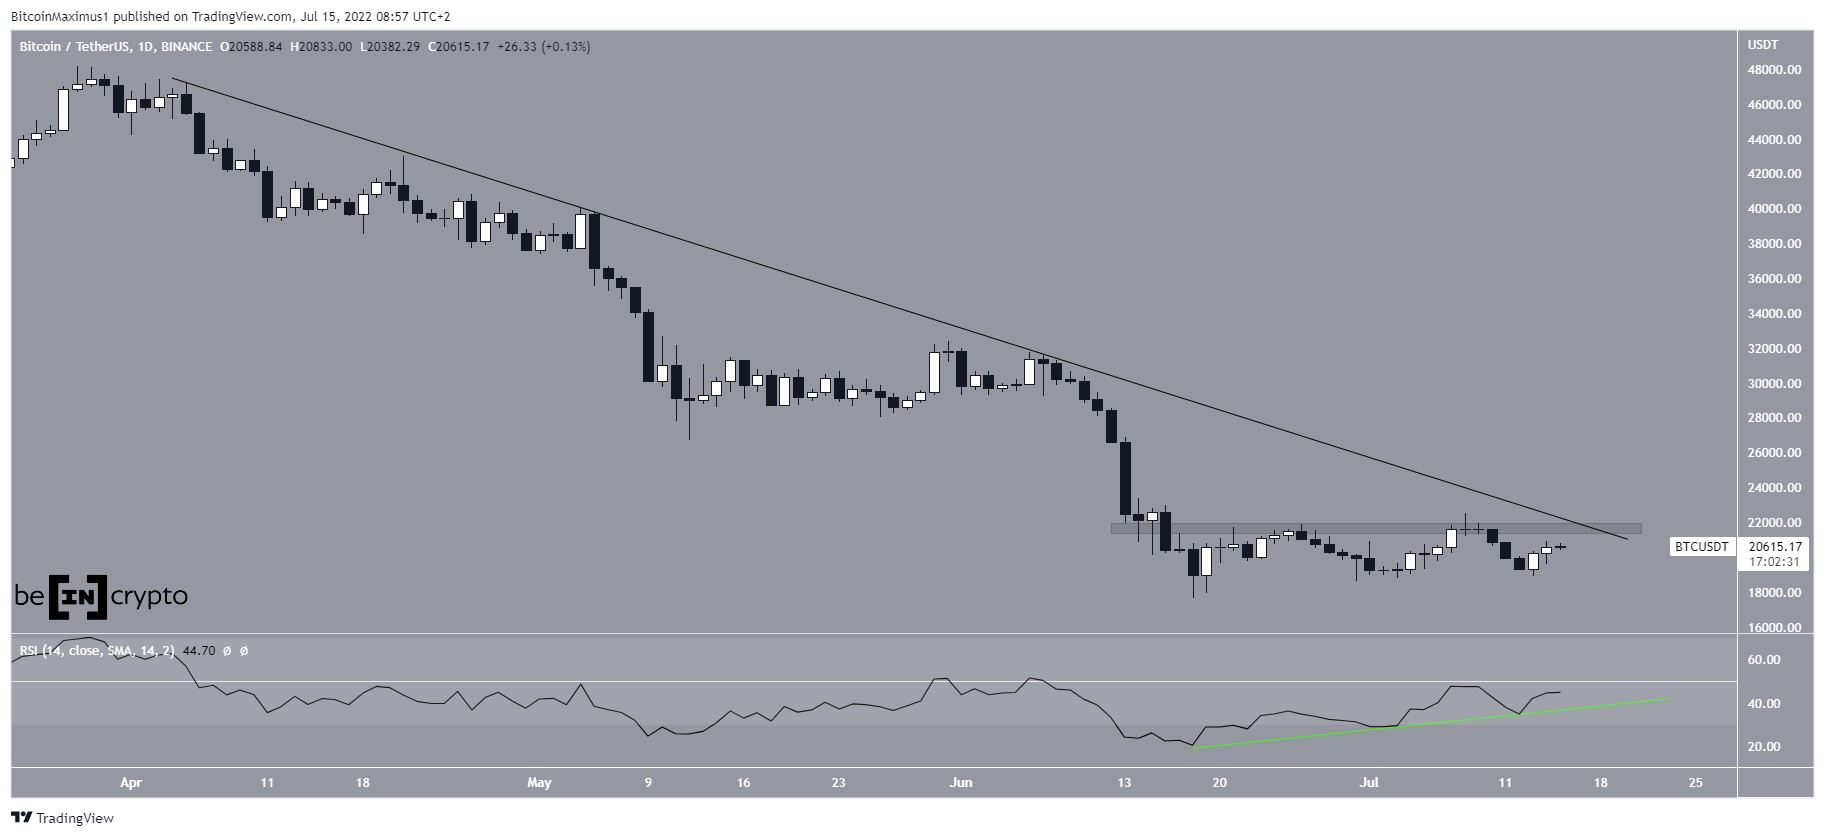
Bitcoin price is trending inside a lengthy consolidation pattern after rallying by up to 170 percent in the second quarter.
As calls for a breakdown move grow, independent market analysis firm TradingShot has released a bullish outlook for the cryptocurrency.
It expects the BTC/USD exchange rate to break bullish, citing two eerily similar fractals that resulted in explosive price rallies.
Bitcoin may have enough fuel left to resume its much-awaited bull run even as it trades inside an overstretched consolidation range. So sees an independent market analysis portal.
TradingShot said on in its Thursday analysis that the BTC/USD exchange rate could head higher in the coming sessions. The portal reached an optimistic conclusion after pitting the pair’s ongoing weekly trend behavior with the ones logged during the 2011-2013 and 2014-2017 bull cycles.
Triangle Consolidation, Golden Cross
A chart published by TradingShot’s analysts highlighted near-perfect similarities between the current and old price trends. The most accurate among them was Bitcoin’s tendency to consolidate near a 0.5 Fibonacci line and to undergo a bullish breakout after a crossover between its 100 and 200-weekly moving averages.
For instance, the end of ‘Cycle 1’ in the chart follows Bitcoin’s test of its 100-WMA (black wave) as support. The price later consolidates until the Fib 2 time extension level (the orange vertical line). Meanwhile, the consolidation pattern appears to make a Triangle with a support level near the 0.5 Fib line holding the bullish bias.
Old Bitcoin fractals hint a breakout session ahead for the cryptocurrency. Source: TradingView.com, TradingShot
Then by the time the 100-WMA crosses above the 200-WMA, Bitcoin breaks to the upside and undergoes a parabolic bull run towards its all-time high near $20,000.
The ‘Cycle 2’, meanwhile, sees Bitcoin crashing towards $3,200 in December 2018. The price again reaches the 100-WMA. It consolidates above the 0.5 Fib line until the COVID-induced sell-off of March 2020 sends it back below the support. Nevertheless, Bitcoin retains the level as its support all over again.
“We are currently on the way to reach the Fib 2 time extension level (orange vertical again),” wrote TradingShot. “[It is] where the price consolidated during the previous cycle.”
The portal noted a similar Triangle formation as Bitcoin consolidated sideways, further indicating the cryptocurrency’s 100- and 200-WMAs attempting to crossover. It added:
“Does this mean we are still going through a lengthy (Triangle) consolidation around the 0.5 Fibonacci retracement level that will start breaking upwards? Very possible based on that model.”
Don’t Expect an 8,000% Bitcoin Rally
TradingShot’s analysts reminded that traders should not expect an explosive rally out of the next breakout.
There will be diminishing returns, they confirmed, adding that lengthening cycles tend to become less volatile over the years. origin »
Since Bitcoin tested the upper boundary of its channel this month, the volatility dropped as it entered a consolidation phase. It is still trying to regain momentum on a daily but lacks enough volume to sustain the rally.
Bitcoin showed signs that consolidation was coming to an end, but demand remained low.
BTC’s price action suggested that a crash to $28,000 could still be on the cards.
If you have been keThe post Bitcoin: What to expect as consolidation draws to a close appeared first on AMBCrypto.
Bitcoin (BTC) rebounded by $2,000 since July 13, but the price action has yet to move outside of its consolidation pattern.
The post Bitcoin (BTC) Continues Consolidation Phase Near $20,000 Support Level appeared first on BeInCrypto.
Bitcoin’s price appears to have entered yet another consolidation phase as it trades between $11,400 and $11,600 Its present lack of momentum comes close on the heels of the strong move higher that it posted last week The resistance above its current price level is quite intense, and this may mark an attempt from bulls to garner greater buy-side support Where the market trends in the mid-term will likely depend largely on whether Bitcoin’s consolidation […]
After opening the month of October trading as high as $10,923, Bitcoin has dropped and has since been in consolidation between $10,500 and $10,600. Volatility has reduced significantly since then as the coin has been in consolidation and the price range has been tightening.
Bitcoin (BTC) has been on a wild ride over the past several weeks, which first began when it incurred a meteoric rally that sent its price surging from lows of $7,300 to highs of $10,600 – a move that marked one of the largest single-day movements ever experienced by the cryptocurrency.
Japan was hit by Typhoon Hagibis this weekend, causing devastation and affecting both the Japanese Grand Prix and Rugby World Cup. So what has been causing devastation and affecting bitcoin and cryptocurrency markets for the past week? Bitcoin Price: Consolidation Station So it seems we are back in a consolidation phase, albeit around the lower underlying price point of $8k.
Bitcoin has further extended its bout of consolidation as it continues trading sideways around the $8,200 level, which appears to be a key support level that BTC’s bulls need to defend in order for the crypto to move higher in the near-term.
Bitcoin suffered another sharp selloff from its earlier consolidation but is finding support at the bottom of the symmetrical triangle on its 4-hour chart. Price could be due for a bounce to the top of the triangle around $6,400 again.
Bitcoin is back to consolidation after a sharp drop last Thursday and a spike this Monday. The sharp drop seen on Thursday was preceded by about two weeks of consolidation where price traded on low volume and volatility reached 2018 lows.
Bitcoin recently formed a flag consolidation pattern after its sharp rally and fade from the triangle top. This is often seen as a bullish continuation signal, with an upside break possibly leading to a climb that’s the same height as the flag’s mast.
Bitcoin is back to consolidating after a price spike on Monday. Price appreciated on Monday from around $6200 to approximately $6800 and has since retraced to about $6450. Volatility also spiked on this rise but has since started to drop as price trades relatively sideways on low volume.
BCH/USD Medium-term Trend: Ranging Supply zones: $600, $700, $800 Demand zones: $300, $200, $100 BCH is in consolidation in its medium-term outlook. The bulls upward price movement was nullified at $479.
Bitcoin Price Key Highlights Bitcoin price is still stuck in consolidation, forming higher lows and lower highs inside a symmetrical triangle on the short-term chart. Price is approaching the peak of this formation so a breakout might be due soon, providing longer-term directional clues.
A strong round of buys hit the market this weekend as unsubstantiated rumors began to circle surrounding Tether and Bitfinex’s potential insolvency. I won’t be going into the details surrounding the allegations because, like I said, they are nothing more than unsubstantiated rumors.
BTCUSD Medium-term Trend: Bullish Resistance levels: $6,609, $6,744, $6,918 Support levels: $6,439, $6,286, $6,145 The BTC broke out from the ranging mode it was last week.
After two weeks of consolidation and volatility forming new lows almost every day, it looked as if the price was going to have a bearish breakout. A fall on Thursday saw price trade below the triangle pattern which had been forming since January.
Bitcoin has formed lower highs and higher lows on its daily time frame to create a symmetrical triangle consolidation pattern. Price has dropped back down to support, which appears to be defended by bulls buying on dips.
Bitcoin Price Key Highlights Bitcoin price also broke below the longer-term triangle support and is aiming lower. This follows a short-term triangle consolidation break, signaling that further losses are underway.
Bitcoin could be in for more losses as it fell through the bottom of the longer-term triangle consolidation visible on the daily time frame. This could mean that further declines are in the cards, although price could still bounce off the line in the sand for bulls around $5,800.
Bitcoin appeared to make an upside break from the long-term triangle consolidation but wound up falling through a short-term triangle support. This brought price back to the longer-term floor, which bulls seem to be defending for now.
BCH/USD Medium-term Trend: Ranging Supply zones: $800, $900, $1000 Demand zones: $300, $200, $100 BCH still remains in consolidation in its medium-term outlook. $517.70 in the demand area was the low the cryptocurrency attained as the bearish pressure within the range continues before the end of yesterday session. The 4-hour opening candle at $520.50 […]
For several weeks, bitcoin has remained in a consolidating uptrend. The market hasn’t seen a new high since mid-September, but the lows have steadily gained higher and higher ground.
Ethereum has declined more than most projects this year as price depreciated from above $1400 in January to a 2018 low of around $173. Over the past month, the price has started to appreciate and form higher highs and higher lows.
The stability of Bitcoin has always been a bit shaky, however, over the past month or so, the leading crypto has been surprisingly… still. If you asked anyone earlier in the year why Bitcoin could never replace fiat currencies the first reason would most likely be due to its volatility and stability.
BCH/USD Medium-term Trend: Ranging Supply zones: $800, $900, $1000 Demand zones: $300, $200, $100 BCH remains in consolidation in its medium-term outlook. The bullish pressure within the range remains strong with BCH making a high of $536.
Bitcoin continues to consolidate as October progresses. Price action is trading around the end of the triangle pattern which has been forming since January. In previous articles, we outlined three potential scenarios which could play out.
BCH/USD Medium-term Trend: Ranging Supply zones: $800, $900, $1000 Demand zones: $300, $200, $100 BCH is in consolidation in its medium-term outlook. The railroad formation at $516. 20 in the supply area dropped the cryptocurrency to $505.
Bitcoin has been stuck inside its symmetrical triangle consolidation for quite some time now, but bulls seem to be getting the upper hand. Price is already closing above the triangle top to signal that a longer-term climb is underway.
In a week when Bitcoin and most of the cryptocurrency market consolidated, Decred has been recording steady rises on significant volume. The digital currency with community governance has been receiving some bullish reviews from online analysts this week, and the price has responded.
The triangle pattern which Bitcoin has been forming since January is approaching its end. Traders seem unsure of how the pattern is going to play out. This week has seen the price of Bitcoin consolidate with the volatility in the price of Bitcoin reaching consecutive lows for 2018.
Bitcoin is continuing its consolidation as the bulls, and the bears seem unsure on where to place positions for the next breakout. The daily RSI has been consolidating into a triangle and trading around showing there is equal pressure from both the buyers and the sellers.
Bitcoin Price Key Highlights Bitcoin is now at the very end of its long-term triangle consolidation pattern, so a breakout could happen anytime soon. Price is currently testing the resistance around $6,600 and a long green candle closing above this could be enough to signal further gains.
After two back-to-back weeks of record-setting volume, ether finds itself situated below historic resistance and currently unable to reach its downtrend line:Figure 1: ETH-USD, Weekly Candles, Downtrend and Record-Setting VolumeFor months, ether has been unable to break its downward trend.
Bitcoin continues to trend higher in an ascending channel but is also consolidating in a short-term symmetrical triangle.
The post Bitcoin (BTC) Price Analysis: Consolidation at Bullish Channel Bottom appeared first on Ethereum World News.
Bitcoin Price Key Highlights Bitcoin price is back down to the bottom of its short-term ascending channel. This coincides with the support of a long-term triangle consolidation pattern, so there may be plenty of buy orders here.
Last week, the price of Bitcoin Cash underwent huge appreciation. However, with markets trading flat and the original Bitcoin trading at its lowest volatility of 2018, Bitcoin Cash is also undergoing a tight consolidation this week.
The volatility of Bitcoin continues to drop to new lows for 2018 as Average True Range (ATR) reaches the 228 value. Bitcoin is currently trading around $6575 at the time of writing with the descending triangle pattern which has been forming since January nearing its end.
Bitcoin Price Key Highlights Bitcoin price is still stuck inside its triangle consolidation pattern on the 1-hour time frame. Price is nearing the peak of its formation so a breakout could take place soon.
Bitcoin Price Key Highlights Bitcoin price has recently broken out of its symmetrical triangle pattern but has since pulled back for a retest. Price continues to hover around the broken resistance, though, and might still have a chance at falling back in consolidation.
On Saturday September 29, cryptocurrency prices are meandering along after an interesting two weeks of ups and downs. Since last week’s crypto market dips, digital asset markets have been seemingly less volatile and many cryptocurrencies are following a tight wedge formation indicating a possible accumulation phase.
Bitcoin Price Key Highlights Bitcoin price recently formed lower highs and higher lows to consolidate in a symmetrical triangle. Price appears to have completed an upside breakout, signaling that more gains are underway.
FUD appears to be dragging Bitcoin price through the mud this week. What is really happening, consolidation or a bearish reversal? Bitcoin Price Market Overview As Bitcoin pulls back from a week of inspiring gains, the mainstream media and an array of Bitcoin pundits are calling this a ‘crash’.
Last week, after a devastating move that shook the market violently up and down for a 7% move in just a few short minutes, bitcoin saw a major sign of strength as it proceeded to have a slow, but steady markup where it managed to establish a local high in the $6,800s:Figure 1: BTC-USD, Hourly Candles, Shakeout Prior to MarkupThis shakeout forced the market to temporarily establish a new monthly low in what could be argued to be a stop-hunt prior to the move to the $6,800s.
The crypto world is welcoming its newest digital currency exchange. Known as BTSE, it’s a platform designed primarily to look after markets and OTC trading. The system is unique in the sense that it offers multiple currencies through one book, and entities like the U.
Bitcoin has broken above its small triangle consolidation to signal that bulls are returning and could lift it back up to upside targets.
The post Bitcoin (BTC) Price Analysis: Was That a Bullish Breakout? appeared first on Ethereum World News.
Bitcoin price is consolidating above the $95,000 support zone. BTC must settle above the $100,000 level to start a fresh increase in the near term. Bitcoin started a fresh increase from the $94,200 zone.
Bitcoin price started a fresh upward move above $100,000. BTC is facing resistance at $103,000 and might aim for an upside break. Bitcoin started a decent upward move above the $100,000 zone. The price is trading below $103,200 and the 100 hourly Simple moving average.
Bitcoin price settled above the $100,500 resistance zone. BTC is consolidating gains and might aim for a fresh increase above the $105,000 zone. Bitcoin started a downside correction from the $106,800 zone.
Bitcoin price started a short-term downside correction from the $106,250 zone. BTC is consolidating above $100,000 and might aim for a fresh increase. Bitcoin started a downside correction from the $106,250 zone.