2026-3-13 01:00 |
Kaspa appears to be coming out of its slumber. Currently trading at $0.03047, the price has bounced off an important support and is moving up to the next barrier. This resistance may play an important role in the price’s future direction.
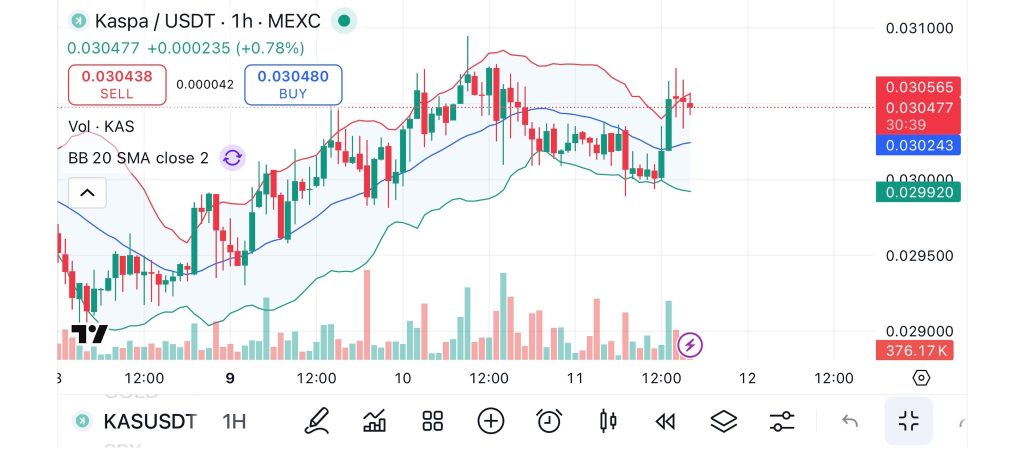
CryptOG indicated the setup on X, pointing out that the KAS price is testing the upper Bollinger Band after a solid bounce off the 20-period SMA. The question on everyone’s mind is whether this leads to a push back toward $0.032 and beyond.
The KAS 1-Hour Chart Tells the StoryLooking at the 1-hour chart, the KAS price is trading at $0.030477. Compared to the previous session, the price has risen by 0.78%.
As the price touched the support area of $0.029200, it was met by buyers who stepped in to contain the price from its dip. Since then, the price of the cryptocurrency has continued to move steadily up, recovering its losses and testing the upper limit of the Bollinger Bands.
Source: X/@realhus2Incidentally, the Bollinger Bands are widening out after being compressed for some time. This could be an indication of an increase in volatility. The price being on the upper end of the bands could also indicate increasing momentum.
However, it is important to be on the lookout for exhaustion if the price continues to move in the same direction. On the volume front, the price has seen 376,170 units of KAS traded on the 1-hour chart. While it is a respectable volume, it is still premature to call it a breakout.
Read Also: DeepSeek Predicts Kaspa (KAS) and Bitcoin Prices If the US–Iran War Ends
Testing Critical ResistanceCryptOG identifies $0.0305 as the immediate resistance level, and the chart confirms this zone as significant. The KAS price has been able to bounce off this region a few times in the recent past, with a corresponding decline in price as the selling pressure takes over. A successful breakout above $0.0305 would be the first higher high in the short-term chart and could result in increased buying.
The next significant price target is around $0.032, which is based on historical data where the asset was able to experience a decline during the February rally. A successful breakout above $0.032 would result in a 5% price appreciation, a reasonable target for a price continuation.
The Bollinger Band Setup and Support Levels That MatterThe Bollinger Band setup provides context to the price movement. The price of the KAS bounced well off the 20-period SMA at around $0.0295.
This price level is considered to be the support level in trending markets. The price continued to move up steadily and finally touched the upper band. The price touching the upper band after the bounce from the middle band indicates that the buying pressure is increasing.
The important question is whether the KAS price will continue to move up along the upper band and thus indicate strong price momentum or will the price be rejected and move towards the middle band.
Currently, the Bollinger Bands are placed at $0.030438 (middle band) and $0.030480 (upper band). The price of the KAS is at an important juncture as the bands are close together. On the downside, the KAS price has support at around $0.029200. This price level was the recent low and the price bounced up from that level.
If the KAS price were to move down further, the next support will be at around the $0.029000 price level. This price level is considered to be the support area where the price will experience higher buying pressure. The KAS price also has support at the 20-period SMA at around $0.029500. As long as the price of the KAS is above this price level, the price will continue to move up.
What Comes Next for the KAS PriceCryptOG’s analysis points to a potential push back to $0.032 if the current setup plays out. For this to happen, KAS needs to break through the $0.0305 price point with conviction and volume.
A close above this price point will confirm the breakout and allow KAS to attempt a move to the February high. However, if the resistance holds and the bullish setup fails, KAS may fall back to the $0.0295 zone. A fall below this price may see KAS fall to the $0.0292 price point. As long as the price is above the latest bounce low, the bullish setup remains intact..
For now, the KAS price sits at a decision point. Bollinger Bands show momentum building. Volume needs to confirm. Resistance at $0.0305 holds the key. A break above targets $0.032. Rejection sends price back toward support. Traders watching this level will have their answer soon enough.
Subscribe to our YouTube channel for daily crypto updates, market insights, and expert analysis.
The post This Trader Predicts Where The Kaspa Price Is Headed Next appeared first on CaptainAltcoin.
origin »Bitcoin price in Telegram @btc_price_every_hour
ETH/LINK Price Action Candlestick Set (LINKETHPA) на Currencies.ru
|
|