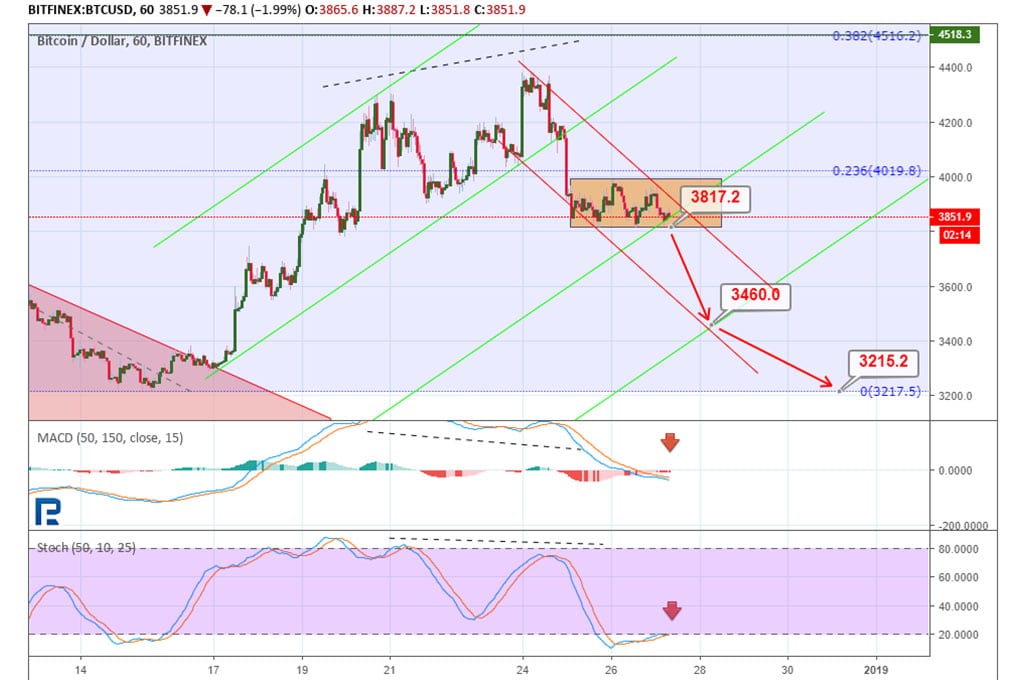
Over the past month, Bitcoin (BTC) has absolutely exploded higher. In fact, the cryptocurrency is up around 40% since the low of $6,400 put in during December of last year.
While many analysts have said that this jaw-dropping rally constitutes a macro reversal that will thrust BTC back into a decisively bullish phase, an analysis recently showed that the recent price action in the crypto market is eerily reminiscent of that seen prior to the 50% decline at the end of 2018.
Related Reading: Watch Out, This New Bitcoin Scam Is All Over Youtube
Bitcoin Might Be Poised to Crash Again
Cryptocurrency trader “Rekt Tekashi” recently posted the two charts below, showing all of Bitcoin’s price action for the past three years alongside three indicators, the Guppy, the Moving Average Convergence Divergence (MACD), and the Relative Strength Index (RSI).
While the charts may look innocuous at first glance, the analyst indicated that the current price action in the BTC market looks near identical to that seen in the middle of July of 2018, which saw Bitcoin see a false bear market breakout to only crash back down.
The similarities between these two market structures exist on the RSI, the MACD, and the Guppy, which all look effectively identical to what these indicators were registering back at that time.
delete this. pic.twitter.com/kkvtPexiQN
— REKT Teka$hi (@Rekt_Tekashi) January 18, 2020
Should Bitcoin follow the path it took in July of 2018, that means that the cryptocurrency market will flatline in the $7,000s before plunging to the $3,000s yet again by the time of the halving — a harrowing prospect for many investors.
Related Reading: Crypto Tidbits: Elon Musk Pokes Bitcoin Bear, Japanese Giants Delve Into Cryptocurrency Mining, Baidu’s Blockchain Beta
And it isn’t only the above analysis that shows Bitcoin’s current breakout may just be a precursor to a further drop. Per previous reports from NewsBTC, another trader noted that BTC’s price action since the $14,000 top in June is eerily reminiscent of that seen in the 2018 bear market, with both cycles seeing a downward price channel, an upward wedge-formed false breakout, declining volume, and signs of capitulation.
This also suggested a crash to the $3,000s could be had.
Some Beg to Differ, Provide Bullish Analyses Instead
While this scary fractal says that Bitcoin will be back at the multi-year lows by the time of the halving in the middle of May, some say the opposite will take place.
Per previous reports from NewsBTC, prominent Bitcoin analyst Financial Survivalism released an extensive analysis on TradingView earlier this month that indicated BTC could hit $20,000 by July 1st, 2020, just six months away.
The commentator, who called BTC’s latest surge when prices were much lower than they are now, wrote in that TradingView post that there is a confluence of positive technical signs that suggest price appreciation is much more likely than downside. These include but are not limited to:
Bitcoin has printed a bullish weekly Lucid SAR candle for the first time since March 2019.
The Average Directional Index just saw a bullish crossover for the first time since March 2019.
The Coppock Curve is rolling higher, showing a trend that is quite similar to that seen in January 2019.
The Ichimoku Cloud on the daily has formed a bullish TK cross.
Related Reading: This Late Night Host Just Exposed Millions to Bitcoin, Again
Featured Image from Shutterstock The post appeared first on NewsBTC. origin »
BTC has struggled to overcome the $25,000 level, but on-chain analysis suggests that the pushback at the key price level is part of the transition out of the bear market.
BTC and select altcoins notched small gains after the Federal Reserve rolled out a 75 basis point rate hike, but technical analysis suggests that further downside is the most realistic outcome.
BTC and altcoins produced the occasional relief rally, but technical analysis suggests that the prevailing trend will remain bearish for some time to come.
Bitcoin (BTC) has finally moved above its September highs. It is increasing towards the next resistance area at $57,200.
The post BTC, ETH, XRP, DOT, DASH, FTM, XLM – Technical Analysis Oct 7 appeared first on BeInCrypto.
Bitcoin (BTC) has moved above another major resistance level and is just short of reaching its September highs. Daily time-frame indicators are bullish.
The post BTC, ETH, XRP, SXP, DCR, THETA, SC — Technical Analysis Oct 6 appeared first on BeInCrypto.
Bitcoin (BTC) has broken out from a descending parallel channel. It is moving towards the $51,200 horizontal resistance area.
The post BTC, ETH, XRP, NEAR, XMR, COCOS, CHR — Technical Analysis Sept 3 appeared first on BeInCrypto.
Bitcoin (BTC) created a bullish engulfing candlestick on August 4 and is making an attempt at reclaiming the $40,550 range high.
The post BTC, ETH, XRP, ZEC, SNX, AAVE, BTT — Technical Analysis Aug 5 appeared first on BeInCrypto.
BTC has managed to bounce at the $30,000 support area and has created a very long lower wick. It is attempting a bullish reversal.
The post BTC, ETH,XRP ZEC, UMA, NEO, CHZ – Technical Analysis, May 19 appeared first on BeInCrypto.
After dropping significantly last month, the cryptocurrency market took another plunge downwards. Let’s take a look at some of our favorite cryptocurrencies – Bitcoin, Ethereum, Litecoin – and see if the charts tell us anything.
Bitcoin Price Analysis (BTC/USD) On an hourly chart, the bulls have dominated the market of BTC/USD pair. The 7 day MA was seen gravitating above the 21 day MA that signaled an increase in bullish pressure.
Bitcoin Price Analysis (BTC/USD) According to an hourly chart, BTC/USD pair has been facing a high vitality in the last 24hrs. BTC/USD pair has thereby slightly dipped by 0. 89% since it opened trading yesterday at $11914.
“When will the bear market end?” is the refrain of bored and frustrated traders across crypto Twitter. “Soon” is the answer suggested by Delphi Digital’s latest report. “Bitcoin Holder Analysis Through Cycles” seeks to determine when selling pressure that has deflated BTC prices over the past 12 months will alleviate, signaling that market recovery could […]
The post UTXO Analysis Points to a BTC Price Bottom in Q1 2019 appeared first on Bitcoin News.
Bitcoin BTC/USD Market From yesterday’s open at $4094 measured to the current levels of $3732.2 the price of Bitcoin has decreased by 8.85%. The price went further down yesterday to $3688.5 but since it interacted with the horizontal support level it started consolidating and recovering and is currently in a sideways but upward trajectory above […]
Bitcoin Price slow down after sinking 10 percent China introduces new privacy quashing blockchain rules Trading volumes steady but bearish Even though today’s losses are low, there is hope for traders as long as Bitcoin prices are oscillating above $3,700.
Bitcoin was previously trending higher inside a wedge pattern but has since broken lower to signal that sellers aren’t quite done yet. The wedge spans $3,700 to around $4,200 so the resulting drop could be of at least the same size.
The honeymoon appears to be over for cryptocurrencies as the Mini Bull Run came to an abrupt end today. The markets have been painted red, with very few coins showing green on daily cryptocurrency analysis charts.
Bitcoin price drop 6. 1 percent after testing $4,100 Korean authorities approve seven exchanges compliant with their security measures The slide below $4,000 at the back of high transaction volumes After today’s losses, subsequent price action would determine whether BTC is within a necessary bull squeeze or the retest of $4,100 marked the beginning of bear.
Bitcoin continues to move sideways inside its symmetrical triangle visible on the 4-hour chart. Price appears to have bounced off support again to form a higher low, indicating that bulls are slowly gaining traction.
Bitcoin Price is ranging inside Jan 6 high low Russia may convert their USD Reserves to BTC to bypass sanctions Trading volumes are low Technically, BTC is bearish from a top-down approach but bullish in the short term.
Bitcoin is still stuck in consolidation for yet another day, but bulls are finding hope in the fact that price was able to hold its head above $4,100 again. Besides, another attempt to break past the near-term resistance appears underway.
Bitcoin Price is up 8. 6 percent at the time of press and firm above $4,000 Unverified sources indicate that Japan FSA gauging interest in Bitcoin ETF Trade volumes light and BTC/USD ranging in lower time frames Overly, the crypto sphere is vibrant.
Bitcoin is still consolidating in its triangle pattern visible on the 4-hour chart after recently getting rejected at $4,200. Price looks ready for another test of support that lines up with several potential inflection points.
Bitcoin [BTC] Price Analysis: A look at the Daily chart for Bitcoin shows that price is currently trading at the $4100 level. Price is trying to make a reverse head and shoulders pattern with a neckline at $4440, coinciding with the 0.
Bitcoin price is trading above the psychological $4,000 mark. Prices are held within a $800 range with upper limits at $4,500 BitFinex and ETHFinex under maintenance DX Exchange rolls out, support Bitcoin Still, Bitcoin prices are consolidating within an $800 but likely to break above $4,500 triggering conservative traders into action.
Latest Bitcoin News By dropping 8,540.4082 BTC, the number of Bitcoin open short positions at BitFinex is down 26 percent at the time of press in the last two days. This decline hint of capital flight and as a major player in the space, a downtime that would see the exchange move their servers from […]
The post Bitcoin Price Analysis: BTC bulls Raved, $4,500 Defining appeared first on Ethereum World News.
Latest Bitcoin News By dropping 8,540.4082 BTC, the number of Bitcoin open short positions at BitFinex is down 26 percent at the time of press in the last two days. This decline hint of capital flight and as a major player in the space, a downtime that would see the exchange move their servers from […]
The post Bitcoin Price Analysis: BTC bulls Raved, BitFinex Server Migration in Progress appeared first on Ethereum World News.
CoinSpeaker
Bitcoin Price Analysis: BTC/USD Trends of January 7–13, 2019
The bullish rally of the Bitcoin price is not certain until the coin breaks out at the resistance level of $4,249 and retests the level.
Bitcoin has formed lower highs and higher lows to create a symmetrical triangle pattern on its 4-hour time frame. Price recently tested support and has bounced back up to the triangle top, perhaps to attempt another break higher.
Bitcoin Fundamentals Hinting At Bear Trend Willy Woo, a leading Australian crypto researcher, analyst, and commentator, recently took to his well-followed Twitter feed to convey his latest bit of Bitcoin (BTC)-related analysis.
Key Points Bitcoin price failed to gain momentum above $3,900 and declined recently against the US Dollar. There is a major contracting triangle formed with support at $3,765 on the 4-hours chart of the BTC/USD pair (data feed from Kraken).
Latest Bitcoin News Aside from Bakkt, the never-ending wait for US SEC to comment or even approve Bitcoin ETF, the crypto and Bitcoin sphere is bereft of market-moving news. True, there are essential updates from time to time and what dominates right now is Overstock plans of “paying” their commercial activity taxes (CAT) using Bitcoin.
Latest Bitcoin Cash News Thing is investors are unfazed and even as speculators rush to the exits research data from Chainanalysis show that most were stockpiling days before prices plummeted ahead of the disastrous hash rate war of the third week of November 2018.
Bitcoin is still stuck in its symmetrical triangle consolidation pattern after getting rejected on the test of resistance. Price is nearing the bottom of the triangle around the $3,900 mark and a break lower could signal that bears have gotten the upper hand.
For the better part of a month and a half, bitcoin has been fairly range-bound and unable to establish new lows or new highs. There are some bullish and bearish setups on the horizon for bitcoin, so let’s check out both sides of the argument because currently the market is sitting in the middle of Indecisionville — the most immediate sign of which is this glaringly obvious head-and-shoulders bottom reversal pattern:Figure 1: BTC-USD, Daily Candles, Head-and-Shoulders BottomThis current pattern is nothing more than a setup at the moment, but it represents one potential outcome of this sustained consolidation.
According to data from DailyFX, almost four out of five Bitcoin (BTC) investors remain long on the number one digital asset by market capitalisation. This analysis runs contrary to the price performance of Bitcoin over the last twelve months.
Latest Bitcoin News At spot prices, Bitcoin may be facing resistance with some investors taking this reprieve to shed off their crypto holding after a year of steep declines. However, in the midst of this recovery, Mike Novogratz, the investor behind Galaxy Digital Holdings—a fund that ultimately plans to become a crypto friendly bank, is.
Bitcoin has also formed a triangle chart pattern which might show an earlier breakout as a preview for its reversal formation. Price has bounced off the triangle bottom and might be due for a test of resistance at the $4,200 mark next.
Latest Bitcoin News The fall from 2017 peaks was a test of resilience and even dashing for those who bought on “dips”. Though the technique called Dollar Cost Averaging may work, last year’s meltdown coincided with a cool off period weeks after the Bitcoin and altcoin market rallied to new highs.
Latest Bitcoin News For novices, the slogan is simple: Not your keys, not your coins. And I mean private keys. You lose it and there goes your coins. They won’t be recovered and will hang in the digital ether forever—unless of course the Bitcoin developer community decide to do something about it —perhaps go the […]
The post Bitcoin Price Analysis: BTC/USD Ready for $4,000, HitBTC Insolvent or “Coin” Run? appeared first on Ethereum World News.
Bitcoin might be ready for a longer-term climb as it forms an inverse head and shoulders pattern on its 4-hour time frame. Price has yet to test and break past the resistance but if it does, bitcoin could be in for a climb that’s the same height as the chart formation.
Latest Bitcoin News Among other advantages, the blockchain is transparent, and once there is a registration, it’s easy to track all transactions related to that address. That’s why this technology is perhaps the most significant innovation of the 21st century.
Yet another tool is being added to Bitcoin’s growing number of privacy solutions. Thought up at a brainstorming event attended by Bitcoin developers and privacy researchers last summer, Pay to Endpoint (P2EP) is a relatively new trick that utilizes the well-known CoinJoin mixing technique to make blockchain analysis much harder.
Latest Bitcoin News As a year comes to a close, BTC prices are stable and bullish. Still, investors are edgy, and unless otherwise, prices surge past key liquidation levels then we shall retain a neutral stand.
BTC has hit a 10-month high in transaction volume. Meanwhile, tx fees are at a multi-year low. These figures indicate that factors such as scaling improvements to the Bitcoin protocol, and the relatively modest price of bitcoin, have made transactions in the cryptocurrency extremely affordable.
CoinSpeaker
Bitcoin Price Analysis: BTC/USD Trends of December 31–January 06, 2019
The bearish candle will have to penetrate and close below the support level of $3,679 before BTC price will experience bearish breakout and this may return it to its previous low of $3,247.
FinExpertiza, a network of Russian auditing and consulting firms, recently analyzed the profitability of various assets which you could have invested in during the year of 2018. Their research found that Bitcoin was the worst one among the bunch.
Key Points Bitcoin price declined recently towards the $3,560 support area against the US Dollar. There is a key bullish trend line formed with support $3,680 on the 4-hours chart of the BTC/USD pair (data feed from Kraken).
Historically, Bitcoin has achieved all-time highs (ATH) on November 28 in both 2013 and 2017. With November 28, 2024, imminent, investors are speculating whether Bitcoin could reach the $100,000 mark on this significant date.
Despite Bitcoin's recent rally, on-chain data reveals the bull market still has plenty of room to grow. Metrics like the MVRV Z-Score, NUPL, and Puell Multiple suggest Bitcoin is far from overheated, pointing to potential for significant upside in the months ahead.
As October approaches, investors are looking ahead to what the month will bring this time around for Bitcoin and the entire crypto industry. Historically, October (often referred to as “Uptober”) has been a month of significant upward momentum for Bitcoin since the crypto’s creation.
Bitcoin fell to lows of $56k again as crypto dumped amid a fresh surge in stocks. Many altcoins are mirroring this dump, including Polygon and Bitcoin Dogs. Yet, as the market experiences new downside pressure at the start of a historically tough September, most experts are doubling down on a bounce for Bitcoin in coming […]
The post 0DOG and MATIC price prediction amid Polygon’s token swap appeared first on CoinJournal.
The cryptocurrency market experienced a significant rally last week, providing a much-needed boost for many short-term speculators to turn profits. Bitcoin led the charge, surpassing the $64,790 mark, though the momentum appeared to have eased by the time of writing.
Both experienced traders and experts are drawn to Litecoin (LTC). Declaring it “about time for LTC to wake up,” John Bollinger, the author of the well-known Bollinger Bands, recently hinted to an upcoming change for LTC.