2021-10-7 14:35 |
Bitcoin (BTC) has moved above another major resistance level and is just short of reaching its September highs.
Ethereum (ETH) has yet to reach the $3,600 resistance area while XRP (XRP) has been rejected by the $1.06 horizontal level.
Swipe (SXP) and Decred (DCR) have bounced since their Sept 7 lows but their trends still seem to be bearish.
THETA (THETA) has broken out from a descending wedge but has yet to reclaim the $6.90 resistance area.
Siacoin (SC) broke out from a descending resistance line but was rejected by the 0.618 Fib retracement resistance level.
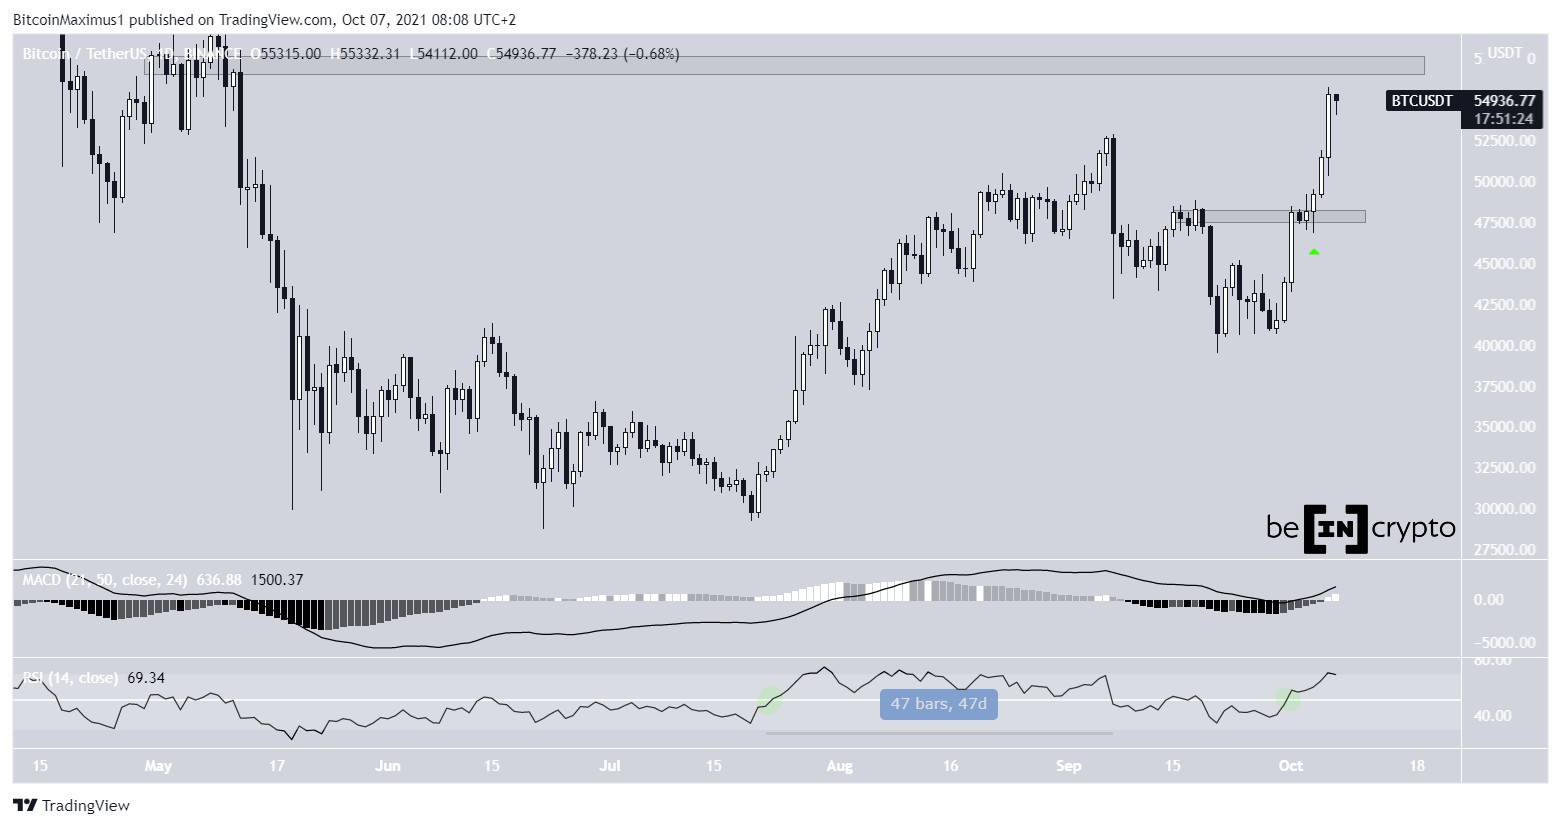
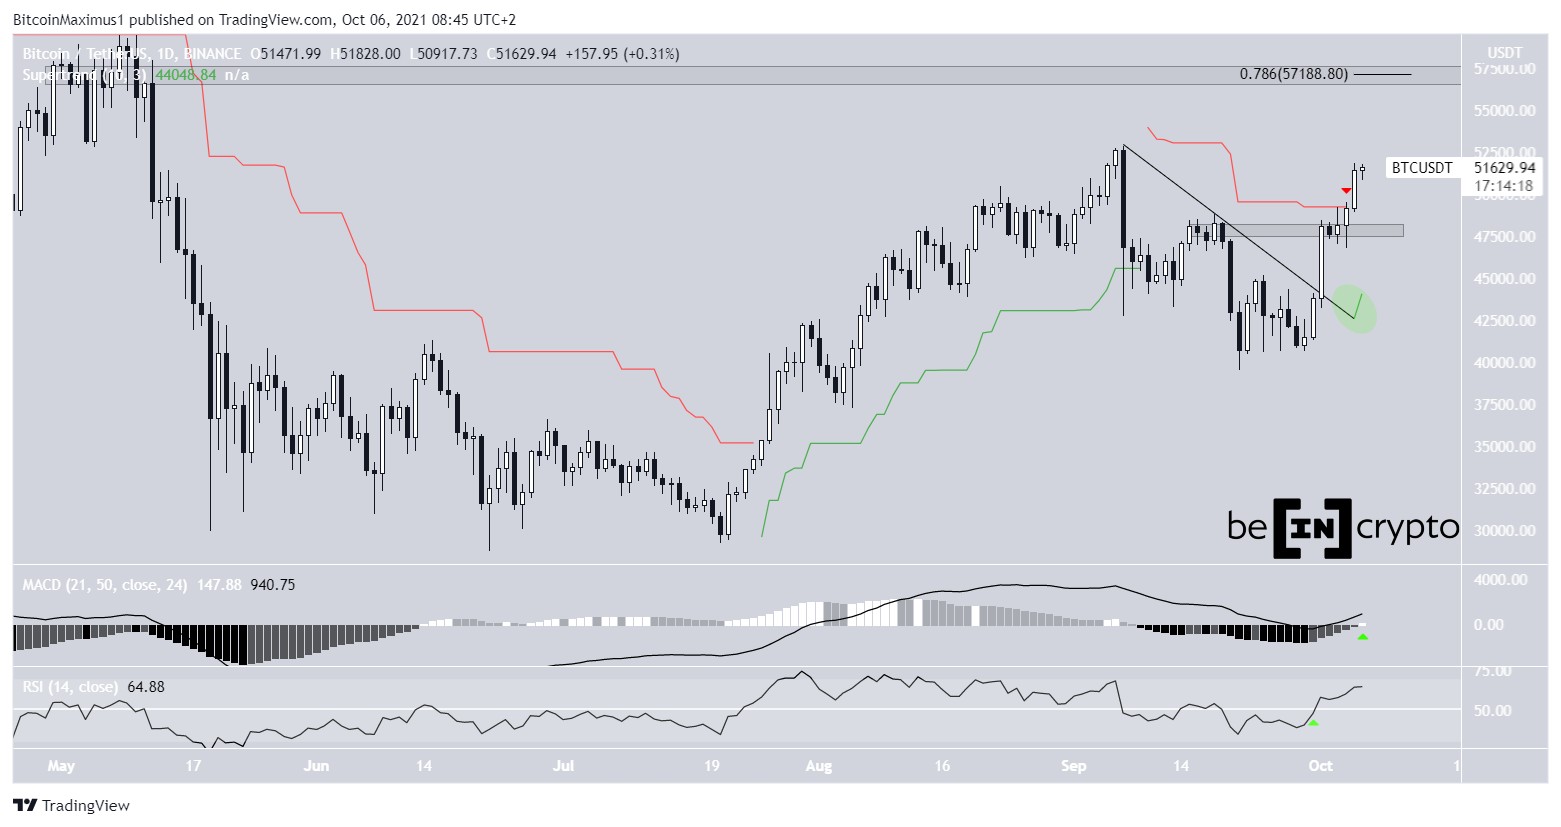
BTCBTC has been moving upwards since breaking out from a descending resistance line on Oct 1. This put an end to the downward movement that had been in place since Sept 7.
The movement since Oct 3 is especially bullish since BTC moved above the $47,600 area first and then overtook the Supertrend resistance line (red icon). The $47,600 area is now expected to act as support if BTC returns to it, while the Supertrend has turned bullish (green circle).
The Supertrend is an indicator created by using absolute high and low prices, and the fact that it has turned green is a sign of a bullish trend. Previously, it was green during the entire upward movement between July 20 to Sept 7.
Similarly, the MACD and RSI are also bullish, as explained in the more detailed analysis here.
BTC Chart By TradingView ETHETH is showing movement that is very similar to BTC. However, there is a noted difference in the fact that it has yet to move above the main horizontal resistance area of $3,600.
Therefore, it’s possible to say that ETH is mirroring the BTC movement with a slight delay.
The MACD and RSI movements are also similar to those of BTC, with the difference being that the MACD is not positive, though its histogram is increasing (green icon). This means that while the short-term trend is increasing at a faster rate than the longer-term trend, it has yet to surpass it.
Today’s movement will be interesting since a close below $3,386 would create a bearish engulfing candlestick. This would be a bearish sign, since the entire upward movement of Oct 5 would be nullified by the Oct 6 decrease.
ETH Chart By TradingView XRPXRP has been increasing inside an ascending parallel channel since July 22. The upward movement initially took XRP above the $1.06 resistance area.
However, the upward move proved to be only a deviation and has been followed by a sharp downward move on Oct 6.
As long as XRP is trading inside this channel, the short-term movement can be considered bearish. Parallel channels usually contain corrective movements, meaning that the previous trend will likely resume after the channel is complete.
In the case of XRP, the previous trend was bearish.
XRP Chart By TradingView DCRDCR has been moving downwards underneath a descending resistance line since Sept 2, when it had reached a high of $186.
While DCR managed to break out on Oct 3, the trend is not yet bullish.
The technical indicators mentioned above are all bearish for DCR. The Supertrend line is bearish (red icon) and has rejected it. Furthermore, the RSI is below 50 and the MACD is negative, indicative of a bearish trend,.
DCR Chart By TradingView SXPSXP has been moving downwards underneath a descending resistance line since Sept 7. This led to a low of $1.95 on Sept 21.
While the price has rebounded since, the previous downwards movement was a five-wave bearish impulse. This means that it’s likely that the primary trend is bearish, and the bounce is only a correction in response to that drop.
There is very strong resistance at $2.95, created by the 0.382 Fib retracement resistance level and the descending resistance line. Until this line is reclaimed, the trend cannot be considered bullish.
SXP Chart By TradingView THETATHETA has been increasing since Sept 3, when it first broke out from a descending wedge. This indicated that the consolidation period that had been going on since Sept 7 has ended.
However, it has yet to reclaim the $6.90 resistance area, which is a prerequisite for the price moving higher.
Nevertheless, as long as the current ascending support line is in place, the trend can be considered bullish.
THETA Chart By TradingView SCOn Oct 3, SC broke out from a descending resistance line. It resumed its upward movement and reached a high of $0.023 on Oct 6.
Despite the considerable increase, the price action is not bullish.
SC was rejected by the 0.618 Fib retracement resistance level and created a very long upper wick. This is considered a sign of selling pressure since the higher prices could not be sustained.
SC Chart By TradingViewFor BeInCrypto’s previous Bitcoin (BTC) analysis, click here.
The post BTC, ETH, XRP, SXP, DCR, THETA, SC — Technical Analysis Oct 6 appeared first on BeInCrypto.
origin »Bitcoin price in Telegram @btc_price_every_hour
Bitcoin (BTC) на Currencies.ru
|
|