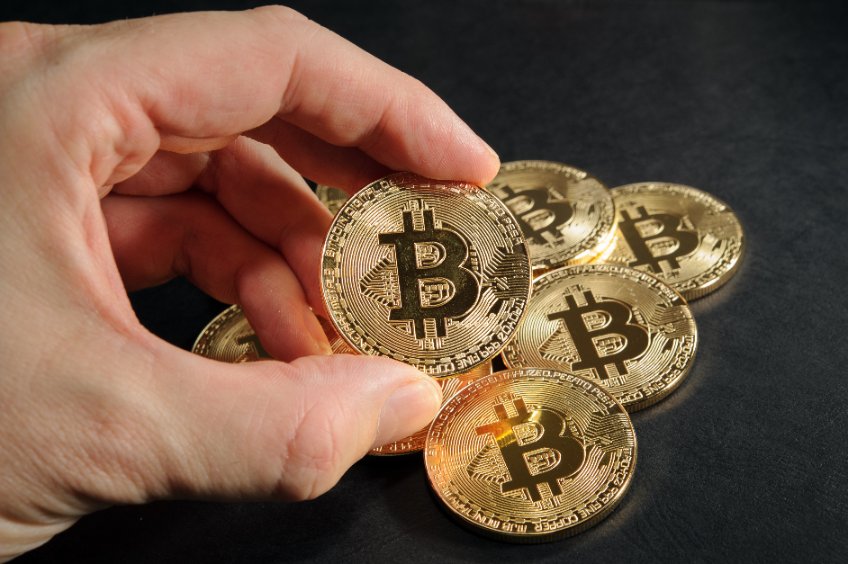
Bitcoin’s price action has been extremely boring over the past two months. The crypto has been range-bound, barely deviating from a medium-term range as bulls and bears duke it out.
Chart of BTC’s price action over recent months by Josh Rager (@Josh_rager on Twitter). Chart from Tradingview.com
This comes in spite of the fact that by multiple on-chain measures, Bitcoin is stronger than ever.
On-Chain Case For a Bitcoin Bull Market Grows Even Further
The CTO of blockchain data firm Glassnode, Rafael Schultze-Kraft observed on July 1st that Bitcoin is strengthening from an on-chain perspective. He observed the following four statistics, all of which have reached notable highs:
Hourly new BTC addresses: two-year high
Hourly active BTC addresses: one-year high
Hourly count of transactions: 10-month high
Hourly spent outputs with a lifespan between 1 hour and 24 hours: an all-time high
Four BTC statistics reaching notable highs as observed by Rafael Schultze-Kraft, the CTO of Glassnode
It isn’t clear why this taking place now, yet there are other on-chain trends signaling fundamental strength for Bitcoin.
As reported by Bitcoinist previously, on-chain analyst Philip Swift noted that the amount of BTC being “HODLed” has reached an all-time high.
“Bitcoin 1yr HODL new ATH!! We have reached a new all-time high, with 62% of bitcoin not moving on-chain for at least 1 year. Strong hands from hodl’ers! Such high levels of HODL’ing have been present at the start of previous Bitcoin bull runs,” Swift wrote on the matter.
Bitcoin 1 year+ HODL Wave indicator from on-chain analyst Philip Swift (@PositiveCrypto on Twitter)
A separate analysis from Schultze-Kraft corroborated this trend.
Data from Glassnode he shared indicated that HODLers have accumulated Bitcoin 90% of the days in 2020. Adding to this, there has been a mass exodus of BTC from exchanges, indicating a decreasing propensity to sell the cryptocurrency.
What’s Holding BTC Back?
If the cryptocurrency is seeing increased usage as both a medium of transfer and a store of wealth, what is holding Bitcoin back?
At least for the time being, it seems to be uncertainty in traditional markets.
Analysts have observed over recent months that a correlation has formed between the S&P 500 and BTC. That’s to say, the cryptocurrency’s directionality has effectively been decided by the equities market.
The image below from digital asset manager Charles Edwards depicts this correlation.
Chart from Tradingview.com
JP Morgan analysts have also observed the correlation. A group of strategists at the bank argued in a June 11th note that since March’s crash, “Cryptocurrencies have traded more like risky assets like equities—a significant change relative to the prior couple of years.”
With the S&P 500 still ping-ponging between 3,000 and 3,200 while pandemic fears still exist, BTC has stagnated as well.
Featured Image from Shutterstock
Charts from TradingView.com
Price tags: xbtusd, btcusd, btcusdt
Stuck in the $9,000s, Bitcoin Isn't Reacting to Strong On-Chain Stats origin »
Bitcoin is experiencing a downturn in exchange-related on-chain activity, indicating decreased investor interest and reduced network usage. Bitcoin's trend continues to lean bearish, currently hovering just above a critical demand zone.
On-chain data shows the Bitcoin long-term holders have finally cooled off their profit-taking after showing a wild selloff just earlier. Bitcoin Coin Days Destroyed Has Calmed Down For BTC Recently As pointed out by BTC on-chain research account “The Bitcoin Researcher” in a post on X, the Coin Days Destroyed In Profit metric has declined […]
Here’s where the next major resistance to clear Bitcoin could lie from the perspective of on-chain analysis. Bitcoin Resistances According To On-Chain Data Bitcoin has recently observed a surge beyond the $27,000 mark, and many have been wondering how long this fresh rally could continue for the cryptocurrency.
Bitcoin has continued to struggle recently as its price is still in the low $29,000 level. Here’s what on-chain data says about if a rebound is likely or not. What Does Bitcoin On-Chain Data Say About The Asset’s Near-Term Outlook? Bitcoin has stagnated recently as the cryptocurrency’s price has failed to keep any significant moves going.
On-chain data shows that spending from Bitcoin long-term holders has spiked recently. Here’s how the current levels compare with the 2021 bull run. Bitcoin 1+ Years Coins Have Been On The Move Recently According to data from the on-chain analytics firm Glassnode, old hands have spent $295 million worth of the asset in recent days. […]
Bitcoin (BTC) has experienced downward price pressure in May, with the token failing to surpass the $30,000 resistance mark. This development could be linked to on-chain activities that indicate an increase in the number of Bitcoins sold on exchanges during this period.
The historical pattern in this Bitcoin on-chain indicator may suggest that the ongoing rally hasn’t reached its top yet. Bitcoin 1-Year Inactive Supply Has Continued To Go Up Recently According to a post from the on-chain analytics firm CryptoQuant, the 1-year inactive supply hit a high back in March of this year.
On-chain data shows the Bitcoin network has been observing a rising amount of transactions recently, something that may be bullish for the price. Bitcoin 30-Day SMA Transaction Count Is Near Cycle Highs Currently According to data from the on-chain analytics firm Santiment, more than 270,000 transfers per day are occurring on the BTC network right now.
Bitcoin has slipped under the $20,000 level today for the first time in two months. Here’s why this plunge may have taken place, according to on-chain data. Bitcoin Price Dropped With Coinbase Premium Turning Negative As pointed out by an analyst in a CryptoQuant post, the U.
In today's analysis, BeInCrypto takes a look at one of the better-known on-chain indicators for Bitcoin: Net Unrealized Profit/Loss (NUPL). Bitcoin (BTC) positive price action in the first weeks of 2023 caused the indicator to generate a signal to start a bullish cycle.
One of the most frequently used on-chain metrics to determine Bitcoin’s performance is the behavior of its long-term holders.
The post Research: This on-chain ratio shows Bitcoin could go lower before final capitulation appeared first on CryptoSlate.
The largest cryptocurrency in the world, Bitcoin [BTC], has had a rough patch in the past few weeks.
With a near-term weakness spotted across some of the coin’s significant on-chain metrics, theThe post Bitcoin: Detailed on-chain analysis for BTC holders to minimize losses appeared first on AMBCrypto.
After hitting the year’s lowest of $17,774 in mid-June, Bitcoin has gained a steady upward trajectory for the last two months.
It also managed to cross the $24,000 mark recently. This indicated The post Betting against the Bitcoin tide? Consider these on-chain metrics first appeared first on AMBCrypto.
Bitcoin on-chain analysis is showing more short-term holders registering losses, and they are statistically more likely to sell, according to Glassnode.
In today's on-chain analysis, BeInCrypto looks at several fundamental indicators that highlight the health of the Bitcoin network: hash rate and mining difficulty ribbon.
The post On-Chain Analysis: Hash Rate Regains Highs, Record Transfers on Bitcoin (BTC) Network appeared first on BeInCrypto.
First in a bigger series of dAppradar’s reports, which explore how value moves around after entering the blockchain industry, revealed that the amount of Bitcoin (BTC) sitting in centralized exchanges (CEX) is at its lowest point in 2021, while Wrapped Bitcoin (WBTC), the first ERC20 token backed 1:1 with Bitcoin, doubled since the start of […]
The post On-chain data reveals crucial metrics about the adoption of Bitcoin, stablecoins, and Cardano appeared first on CryptoSlate.
In this article, BeInCrypto takes a look at on-chain bitcoin indicators like the Stablecoin Supply Ratio (SSR) and the (USDT) supply on exchanges.
The post Bitcoin On-Chain Analysis: Stablecoins Show Considerable Buying Power appeared first on BeInCrypto.
A Bitcoin on-chain metric, the Puell Multiple, temporarily fell to the “undervalued zone” before snapping back as BTC prices recovered, data from GlassNode on July 5 shows. The Puell Indicator Falling in lockstep with Bitcoin Hash Rate According to a screen-grab, the indicator has been used by on-chain analysts to pick out bottoms on severalRead More
The price of Bitcoin dropped below $16,400 on the day following a massive short-term correction. On-chain analyst Willy Woo attributed the pullback to an overheated bull run. Before the pullback happened, the Bitcoin derivatives market showed signs of extreme buyer demand.
Bitcoin’s on-chain data holds the key to understanding investor behavior. If interpreted correctly, the top indicators can provide investors with an edge in making investment decisions and improving their Bitcoin...
The post 3 More On-Chain Metrics to Upgrade Your Bitcoin Trading appeared first on Crypto Briefing.
On-chain metrics reveal that the Bitcoin SV network is growing steadily. Meanwhile, its price sits on top of a significant support barrier. Overcoming market challenges Bitcoin SV has been in the center of controversy since it forked off Bitcoin Cash in mid-November 2018.
The Bitcoin daily transaction volume is now at its highest level since January 2018 showing increased on-chain economic activity. Meanwhile, transaction count and average blocksize on the network continue to move in the same upward direction, proof that the 1MB blocksize limit is well and truly a thing of the past in the post-SegWit Bitcoin era.
After months of declines, bitcoin’s on-chain transaction volume has hit a 10-month high, according to a new report from blockchain data provider TokenAnalyst. The report, discussed in this week’s issue of Diar, shows that real bitcoin trading volume has risen three months in a row.
As part of its efforts to be regulatory compliant, Malta-based crypto exchange Binance has partnered with Blockchain startup Elliptic. According to a Coindesk report, the partnership will help Binance mitigate anti-money laundering (AML) concerns as it expands into new regions.
Although many traders and analysts alike are currently looking towards relatively small Bitcoin price movements for greater insight into where the crypto is heading next, recent data regarding BTC’s on-chain transaction volume may signal that the cryptocurrency is currently incurring greater fundamental strength.
The recent report by Diar outlined the drop in Bitcoin’s on-chain transaction volume causing it to “hit new lows quarter-on-quarter since” mid-2017. However, the report mentioned that the increase in the on-chain monthly transactions in USD valuation had increased and hit a value of 132.
В апреле долларовый объем ончейн-транзакций в основной сети биткоина обновил 10-месячный максимум, преодолев рубеж в $130 млрд. В последний раз такие значения были зафиксированы в июне прошлого года, когда цена первой криптовалюты была выше на 35%.
We have already seen how the fiat currencies around the world, be it Argentina’s peso, Venezuelan Bolivar or Turkish Lira, are failing as a currency. Countries all over the world are being run over by rising inflation and dropping value of their money, along with slowing economy and political unrest. It isn’t surprising South America […]
Lightning Labs just released an alpha version of its Lightning Network wallet. The desktop application is now compatible with Bitcoin’s mainnet and it leverages Neutrino (the protocol, not the analytics company acquired by Coinbase) to give users a lightweight option to “control their own funds,” as opposed to running a full node or trusting a third party to play custodian.
Bitcoin scaling solutions may be getting huge publicity in 2019, but the amount of money the network processes daily could already cause headaches for competitors. Bitcoin Usage Tramples Venmo As Morgan Creek Digital co-founder Anthony Pompliano noted on social media April 17, Bitcoin’s ‘on-chain’ transaction volumes grew to $7 billion per day earlier this week.
The cryptocurrency market saw a rise in the price of most major cryptocurrencies, including Tezos [XTZ], Bitcoin Cash [BCH] and Litecoin [LTC], on April 15. The price of the largest cryptocurrency, Bitcoin [BTC] also remained above $5k and noted minimal growth.
Close to $7 billion worth of bitcoin has moved on-chain in the past 24 hours, with 1.3 million bitcoin exchanging hands or changing addresses. More than a quarter of a...
The post Bitcoin Processed $7 Billion Worth of Transactions in the Past 24 Hours appeared first on Trustnodes.
There are Bitcoin off-chain scalable solutions such as the Lightning Network, but that would not make you immune to on-chain transaction fees which are expected to rise over time as blocks become full.
The number one cryptocurrency Bitcoin (BTC) has been for over ten years now and is so far known as lead cryptocurrency in the world. Apart from celebrating its tenth year of existence, another major event in 2019 is the network reaching over 400 million transactions since 2009, as reported by ‘Gielbier’ on Reddit.
Bitcoin’s first decentralized exchange to make use of the Lightning Network’s Atomic Swaps is now in beta. Sparkswap, an exchange with backing from Pantera Capital (which announced its ambitious mission to become the most decentralized bitcoin exchange on the market in August 2018), has now opened its beta to users.
New announcements around Bitcoin’s Lightning Network have been coming almost nonstop lately, with new exchanges, wallets and other services popping up seemingly every day.
The Lightning Network is growing stronger every day. In addition to seeing the number of nodes double in a few months, a new project has added another element of crypto infrastructure: an account-free, non-custodial cryptocurrency exchange.
Bitcoin price is consolidating above the $95,000 support zone. BTC must settle above the $100,000 level to start a fresh increase in the near term. Bitcoin started a fresh increase from the $94,200 zone.
Bitcoin price started a fresh upward move above $100,000. BTC is facing resistance at $103,000 and might aim for an upside break. Bitcoin started a decent upward move above the $100,000 zone. The price is trading below $103,200 and the 100 hourly Simple moving average.
Bitcoin price settled above the $100,500 resistance zone. BTC is consolidating gains and might aim for a fresh increase above the $105,000 zone. Bitcoin started a downside correction from the $106,800 zone.
Bitcoin price started a short-term downside correction from the $106,250 zone. BTC is consolidating above $100,000 and might aim for a fresh increase. Bitcoin started a downside correction from the $106,250 zone.