2021-6-18 14:09 |
BeInCrypto takes a look at the eight altcoins that decreased the most over the past seven days, from June 4 to 11.
These altcoins are:
Kusama (KSM): -28.41% Internet Computer (ICP): -19.62% Nexo (NEXO): -12.88% DigiByte (DGB): -12.07% Bitcoin Gold (BTG): -12.02% Siacoin (SC): -10.47% BitTorrent (BTT): -10.43% Qtum (QTUM): -9.96% KSMKSM initiated an upward move after a sharp fall on May 19. The increase continued until a high of $537 was reached on June 10.
KSM has been moving downwards since, potentially trading inside a descending wedge.
In addition, it’s trading inside the $345 horizontal support area, which is also the 0.5 Fib retracement support.
Despite this, there are no bullish reversal signs in place yet.
KSM Chart By TradingView
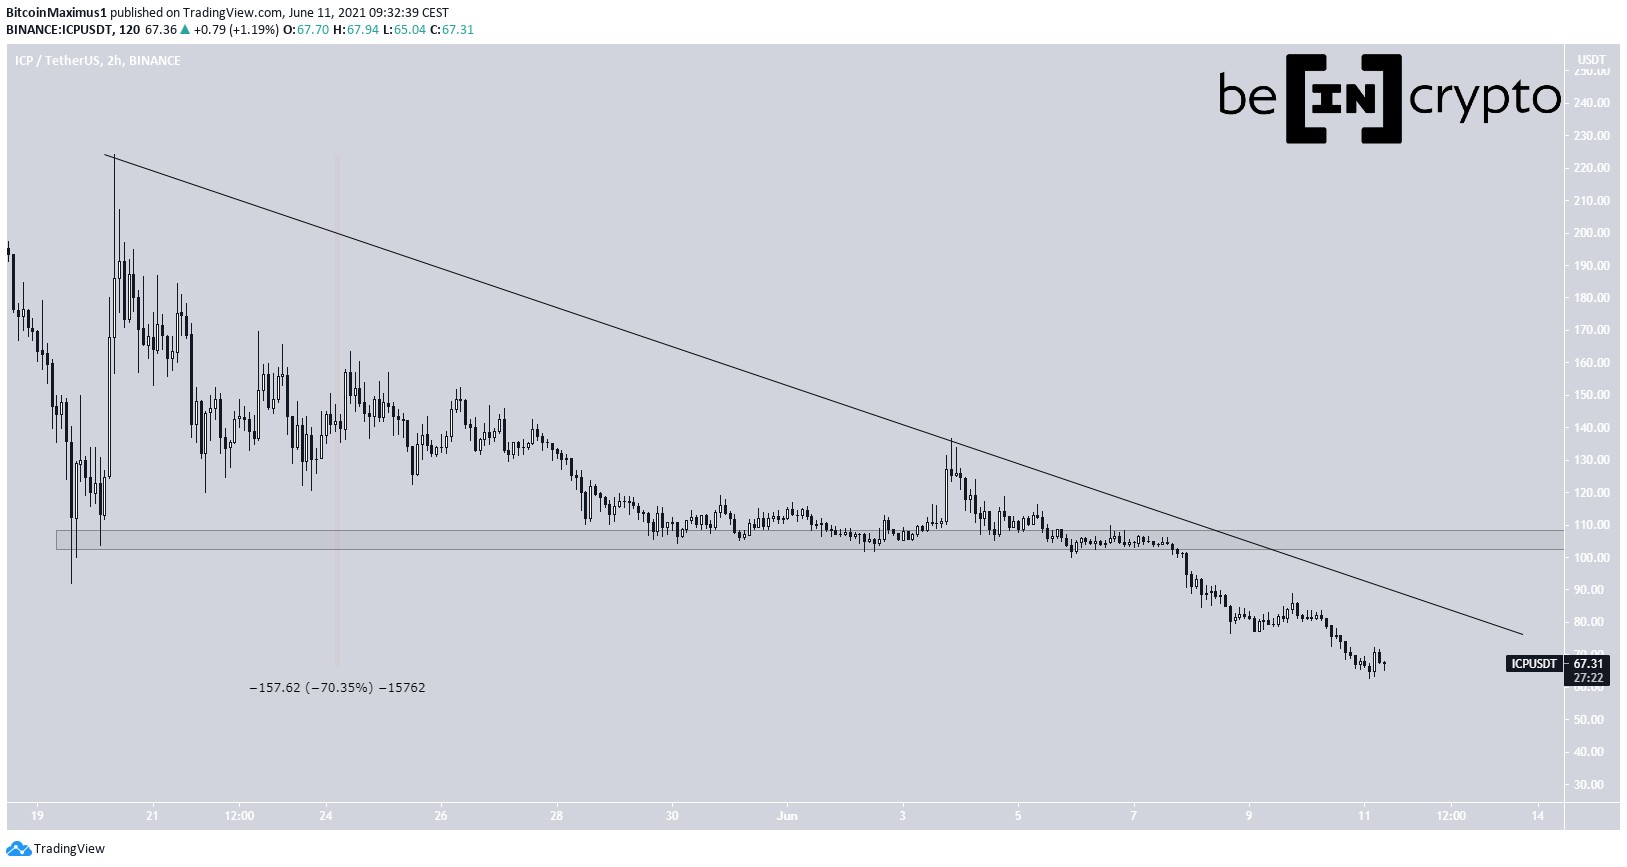
ICPICP has been decreasing alongside a descending resistance line since reaching a high of $224 on May 20.
While following the line, it reached a new all-time low price of $51.02 on Jun 17. This created a potential double bottom pattern relative to the price on June 12. The pattern was also combined with a bullish divergence in the RSI.
However, ICP has yet to break out from the descending resistance line. Doing so could trigger an upward move towards the closest resistance at $110.
ICP Chart By TradingView
NEXONEXO has been falling since May 26 after it reached a high of $2.97. It created a lower high on June 7 before falling once more.
It’s currently trading at the $1.80 support area, validating it for the third time.
While there are no definite bullish reversal signs, the trend can be considered bullish as long as NEXO is trading above this level.
A breakdown could trigger a sharp fall towards the $1 support level. On the other hand, the closest resistance is found at $2.57.
NEXO Chart By TradingView
DGBDGB has been following a descending resistance line since May 20. This line has rejected DGB multiple times up to this point (red icons).
The main support level is found at $0.052. Combined with the descending resistance line, it creates a descending triangle, which is normally considered a bearish pattern.
Currently, DGB is trading directly above this support area.
A breakdown could trigger a sharp fall towards the $0.03 support level.
DGB Chart By TradingView
BTGBTG has been trading inside an ascending parallel channel since May 19. Throughout the channel, it has been twice rejected by the $72 horizontal resistance area.
On June 9, it initially managed to reach a high of $84.55 before falling sharply. The high served to validate the resistance line of the channel before falling below the aforementioned resistance area.
BTG has currently retraced to the support line of the channel once again.
Parallel channels are usually corrective, so a breakdown would be the most likely scenario to play out.
BTG Chart By TradingView
SCSC reached the $0.0141 support area on May 19 and bounced. However, the upward movement was short-lived and the price has revisited the support several more times since then.
An interesting development is that each bounce has been weaker than the preceding one. This is a sign of weakness and has created a descending resistance line.
Therefore, SC breaking down below this support area is the most likely scenario. In that case, the next closest support would be found at $0.008.
SC Chart By TradingViewn
BTTBTT had been decreasing alongside a descending resistance line since reaching an all-time high price of $0.0134 on April 5.
It appears to have broken out on June 13 but has failed to sustain any upward movement. On the contrary, it has fallen to the $0.003 support area once again.
The closest resistance is found at $0.0048.
BTT Chart By TradingView
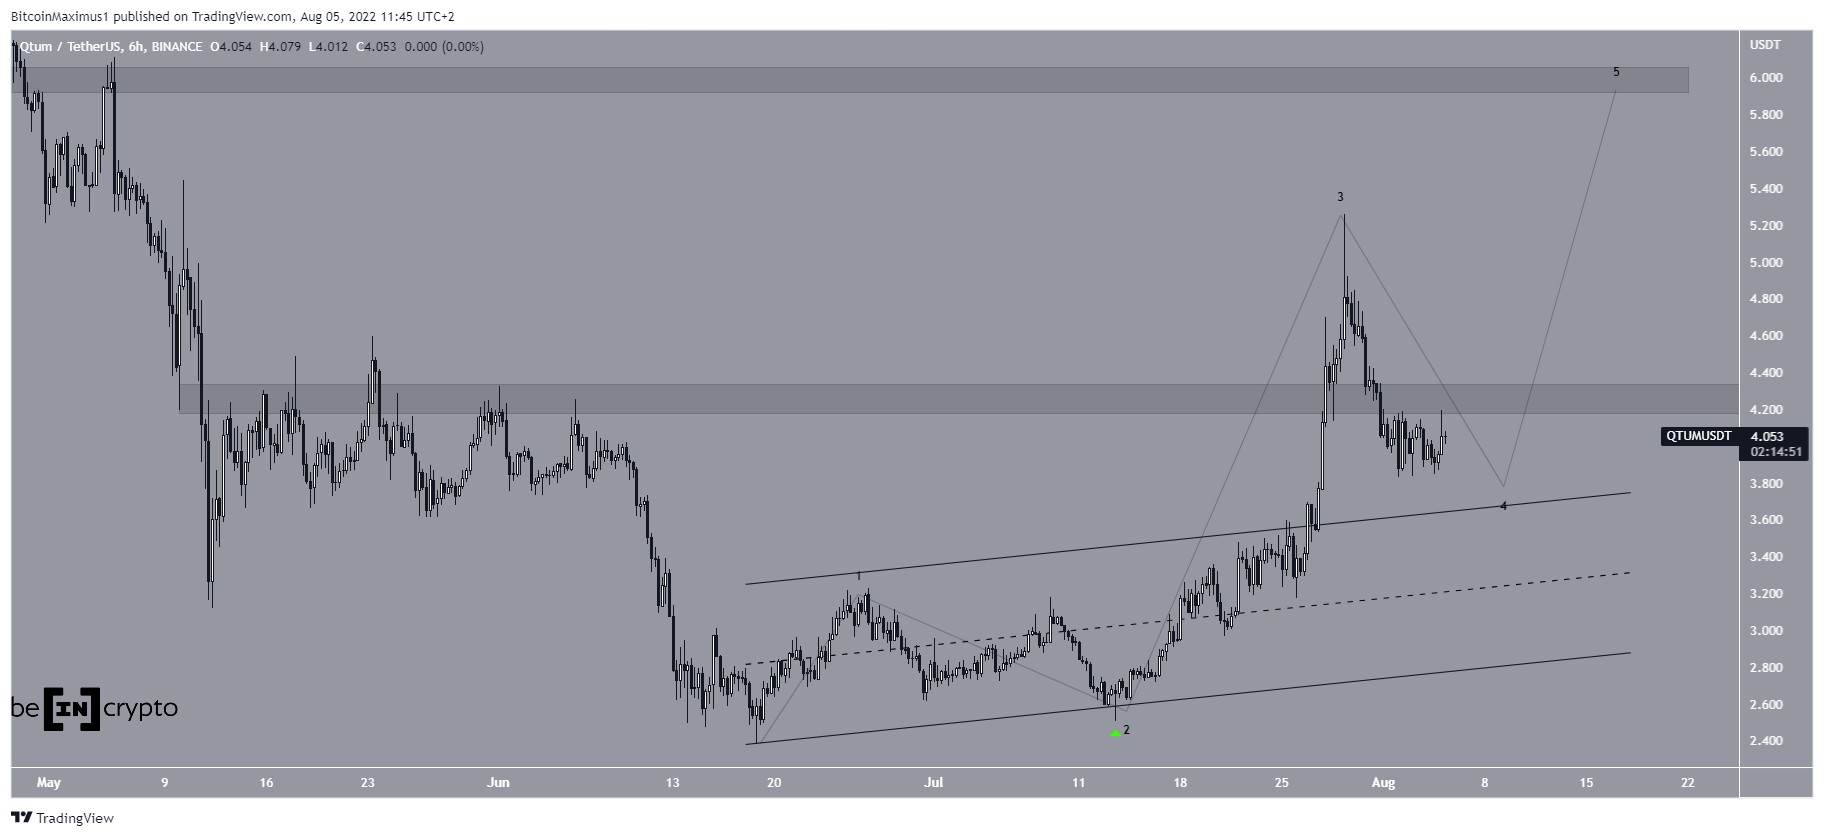
QTUMOn May 23, QTUM reached a low of $6.37 and bounced. This move and the subsequent closing prices validated the $8.40 area as support. This is a level that previously acted as resistance in February 2021.
However, the ensuing upward movement could not be sustained and QTUM has returned to the $8.40 support area once again.
Whether it makes a higher low or breaks down from this support area will likely determine the direction of the future trend.
The next resistance is found at $17.50 and QTUM has a lower support level at $4.80.
QTUM Chart By TradingView
For BeInCrypto’s latest bitcoin (BTC) analysis, click here.
The post The Hateful Eight: KSM, ICP, NEXO, DGB, BTG, SC, BTT, QTUM — Biggest Losers, June 11-18 appeared first on BeInCrypto.
origin »Bitcoin price in Telegram @btc_price_every_hour
Eight Hours (EHRT) на Currencies.ru
|
|