2022-8-5 17:00 |
Be[In]Crypto takes a look at the five cryptocurrencies that decreased the most last week, more specifically, from July 29 to Aug 5.
These cryptocurrencies are:
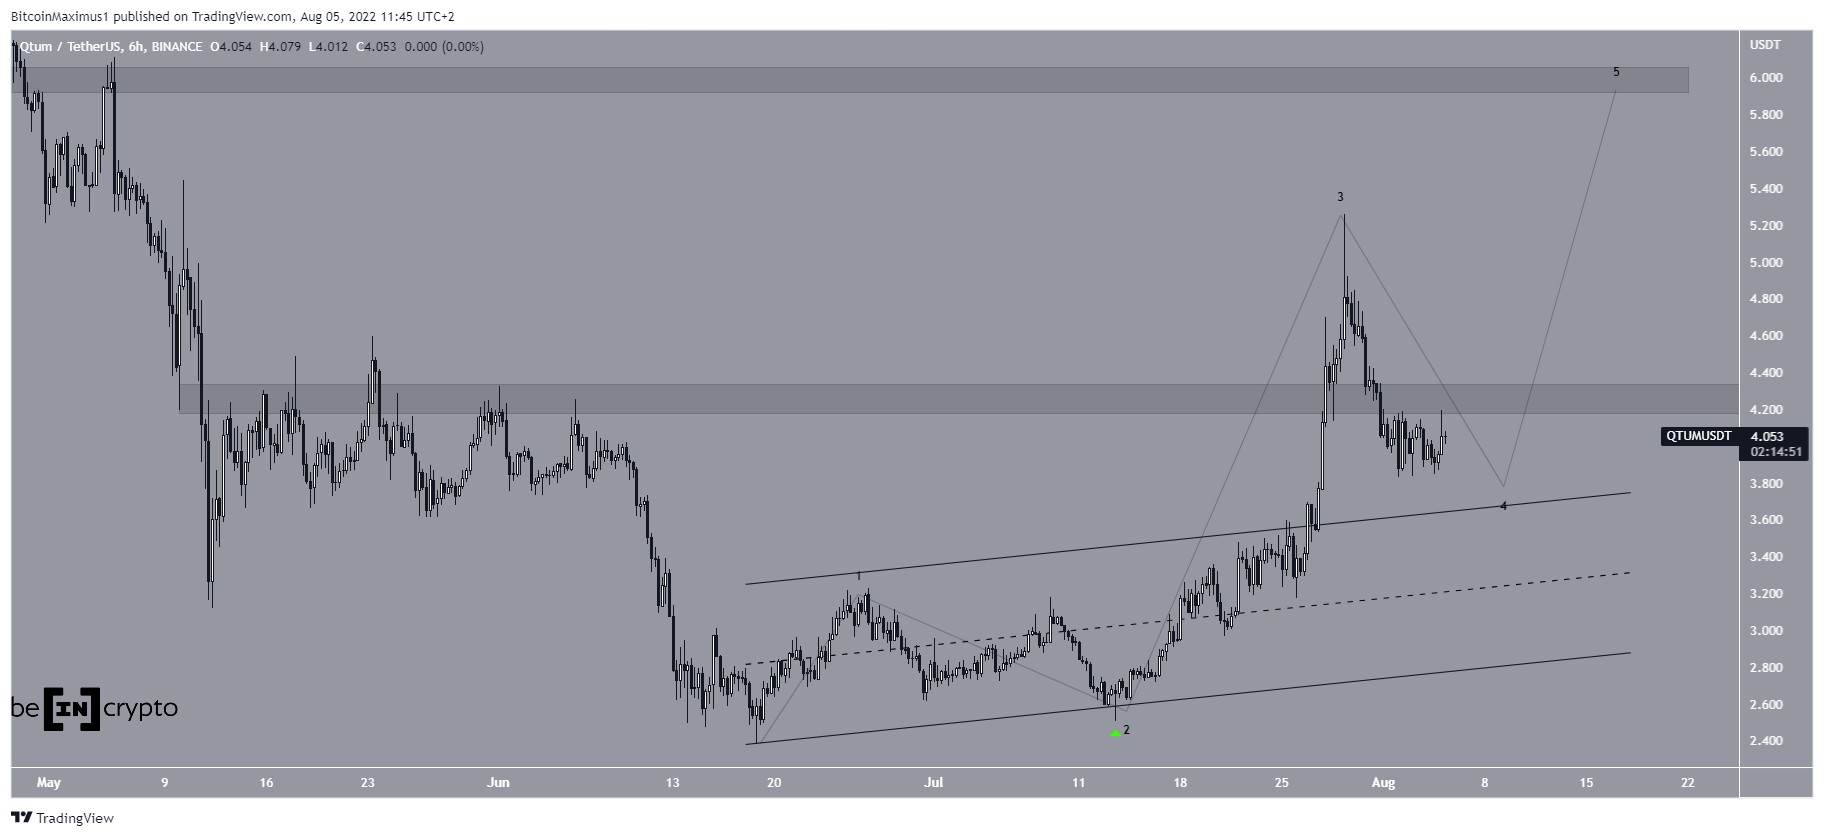
Qtum (QTUM) : -19.40%Bitcoin Gold (BTG) : -17.56%Ethereum Classic (ETC) : -15.16%Bitcoin Cash (BCH) : -12.63%Convex Finance (CVX): -8.98% QTUMQTUM has been increasing inside an ascending parallel channel since June 18. It bounced at the support line of this channel on July 13 and managed to break out on July 27. This led to a high of $5.25 two days later.
However, the price has been decreasing since and fell below the $4.30 horizontal area in the beginning of Aug. The area is now expected to provide resistance.
It seems that the price is completing a fourth wave pullback, after which another upward movement will follow.
QTUM/USDT Chart By TradingView BTGBTG began an upward movement on July 13 and broke out from a descending resistance line on July 22. It proceeded to reach a high of $38.50 on July 29.
However, it was rejected by the 0.618 Fib retracement resistance level (red icon) and has been falling since. So far, it has reached a low of $26.45.
Since the $26.50 area previously acted as resistance, it is now expected to provide support.
BTG/USDT Chart By TradingView ETCSimilarly to BTG, ETC broke out from a descending resistance line on June 24. It increased rapidly afterward and proceeded to reach a high of $45.36 on July 29.
The entire increase seems to be a completed five-wave upward movement.
Since then, ETC has been correcting in what seems to be an A-B-C corrective structure. If so, the 0.5-0.618 Fib retracement support area $25-$29 would be expected to provide support.
ETC/USDT Chart By TradingView BCHBCH has been increasing since July 13 and broke out from a descending resistance line on July 28. It returned to validate the line as support five days later (green icon). The bounce also coincided with a validation of the $133 horizontal support area.
Whether the price breaks down or bounces at this level will likely determine the direction of the future trend.
BCH/USD Chart By TradingView CVXCVX has been increasing inside an ascending parallel channel since June 20. Such channels usually contain corrective movements. This means that an eventual breakdown from it would be likely.
Currently, CVX is trading right at the support line of this channel.
If it breaks down, the main support area would be at $5.30, created by the 0.618 Fib retracement support level and a horizontal support area.
CVX/USDT Chart By TradingViewFor Be[in]Crypto’s latest Bitcoin (BTC) analysis, click here
The post Ethereum Classic (ETC) Retraces After Sharp Increase: Biggest Weekly Losers appeared first on BeInCrypto.
origin »Ethereum Classic (ETC) на Currencies.ru
|
|
