2022-9-19 18:15 |
Stellar (XLM) has seen a stunning turnaround after the recent market downturn. However, following the announcement of the CPI report and corresponding fears of an interest rate hike, a sell-off ensued.
The Donchian channel indicates that the average price of XLM is $0.1076 as of this writing. After a drop, the Awesome Indicator also gives off very strong bullish signs.
This could signal a rebound. The XLM market has showed a spectacular recovery from the September 13 catastrophe, with prices climbing back above the $0.1004 support line that sustained the downturn from August 14 to September 6.
At the 4-hour time mark, the coin is following an uptrend. Looking at the wider picture, however, we see that the upturn may be short-lived.
Stellar Rally Gives Investors Some ConfidenceThe XLM token closely tracks Bitcoin’s price movements because the whole cryptocurrency market is modeled after it. The downward pressure of the triangle indicates that the coin’s motion is heading in a downward direction.
Price levels of support and resistance were calculated using the Fibonacci retracement tool. The bulls are attempting to leverage two supports located at $0.1023 and $0.1058.
These two factors have bolstered traders’ and investors’ optimism, which has contributed to the price increase.
The range of $0.1153 represents the resistance level. If price momentum overcomes this resistance, the price might rise to the $0.1234 region. This can be a strong purchase signal for investors and traders.
Indicator of momentum also demonstrates bullishness. In addition to purchase signals, moving averages are currently sending buy signals. For the market to rebound, however, bulls must have sustained momentum in order to surpass the $0.1194 and $0.1234 resistance levels.
Looming Interest Rate Hike To Determine XLM PriceEven for the broader cryptocurrency market, this can be a challenging issue. As previously indicated, XLM and other cryptocurrencies on the market share a strong correlation with Bitcoin which, in contrast, tracks the S&P 500 Index.
In light of this, XLM’s mini-rally could be imperiled if larger financial markets continue to fear an impending interest rate hike. The XLM price is already struggling to surpass the $0.1153 barrier level.
From the 10th until the 13th of September, the coin has already tested the specified resistance level. The coin is trading close to the resistance level of $0.1153 at the time of writing.
The presence of long candles on the charts may signal another attempt to break out of a trading range. If the price falls again, it should not breach the $0.1023 support level, since doing so could spark a bigger sell-off.
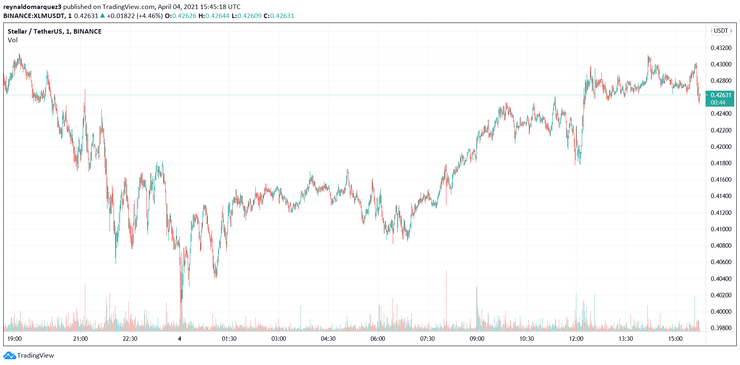
XLM total market cap at $2.8 billion on the daily chart | Source: TradingView.com Featured image from Zipmex, Chart: TradingView.com (The analysis represents the author's personal views and should not be construed as investment advice). origin »Bitcoin price in Telegram @btc_price_every_hour
Stellar (XLM) на Currencies.ru
|
|


