2019-3-9 18:29 |
XLM Daily Chart – Source: Tradingview.com
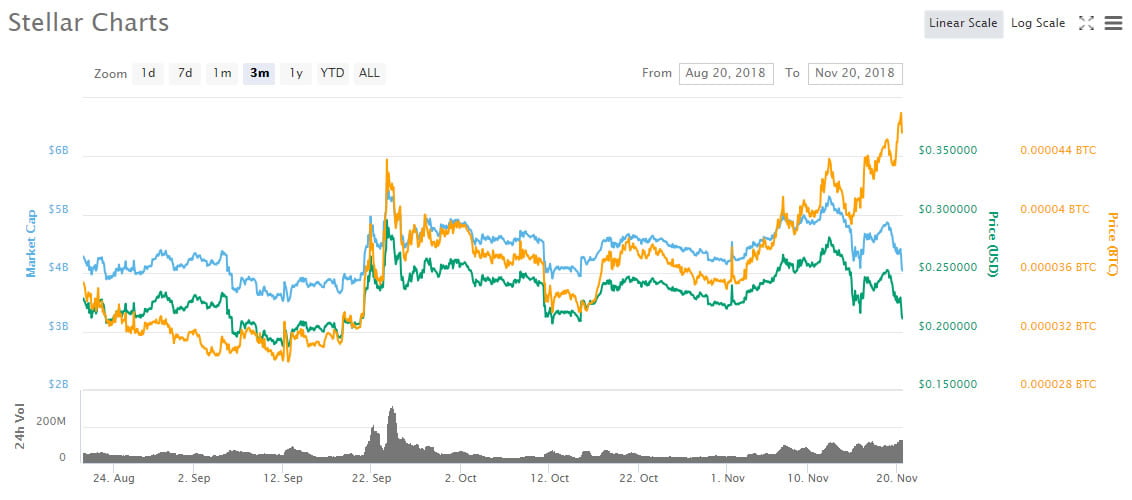
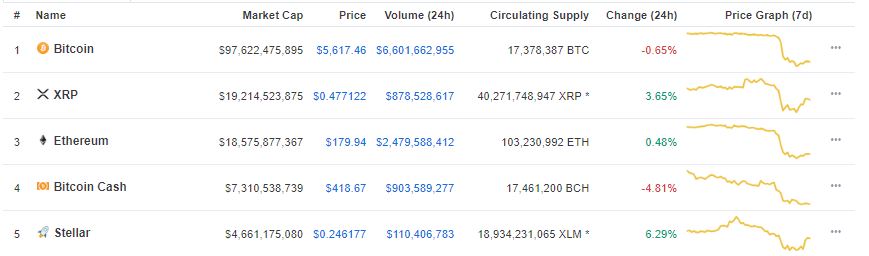
We are seeing an uncommon occurrence over the past 24 hours with Stellar Lumens (XLM) being the top performer among major cryptocurrencies.
Data from Messari shows XLM increasing 4.22% over the past 24 hours whereas most other top cryptocurrencies are recording losses over the same time period.
One factor which may be playing into this outperformance is the ascending triangle pattern forming.
An ascending triangle pattern is a bullish trend continuation pattern that comprises of an uptrend line forming from higher lows and also a resistance line.
XLM 4-Hour Chart – Source: Tradingview.comPrice has been forming higher lows since early February. The 4-hour MACD and RSI have also been increasing reflecting higher buying pressure.
Price briefly managed to rise above the $0.096 resistance level near the end of February, but sellers quickly came in to bring the price back below. Price has since met support at the upper trendline.
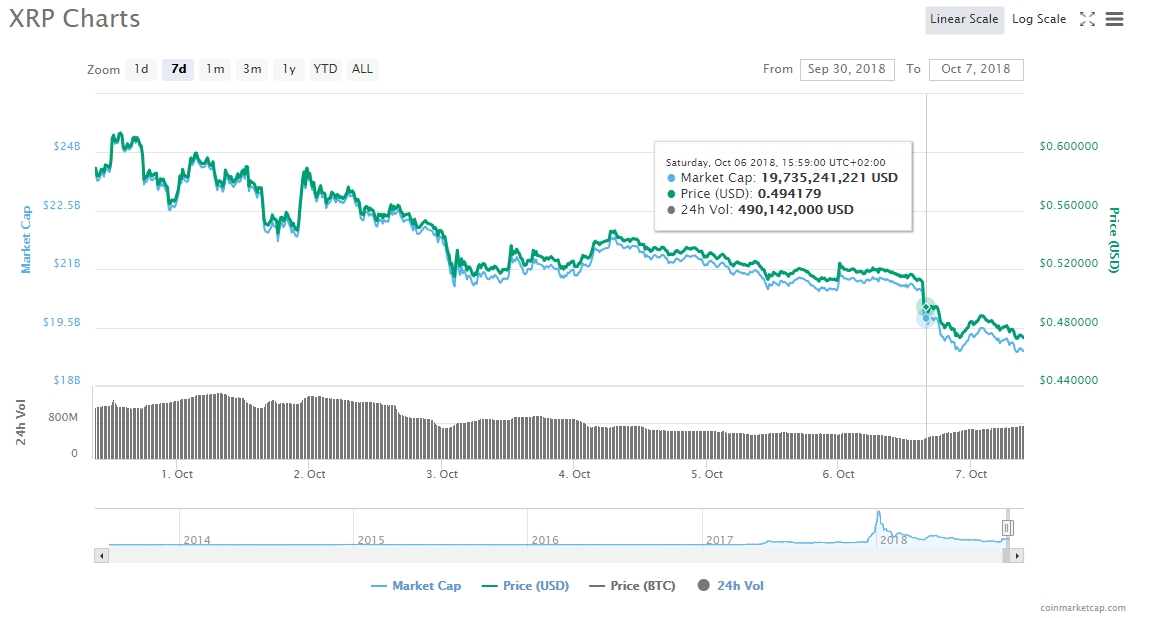
XRP Weekly Chart – Source: Tradingview.comThe price for XRP has been consolidating for almost two months. The last eight weekly candles have all formed with small bodies showing a small range of trading.
Price has managed to close each week above a key support level at $0.295. Any drops below were followed by a recovery before the candle closed.
The key longer-term level to monitor for the price of XRP is $0.2475. This an important level on the monthly timeframe chart and was also the point of a breakout in December of 2017.
XRP Daily Chart – Source: Tradingview.comOn the daily timeframe, the price has mostly been consolidating around $0.313. Many daily candles have consolidated around this point and closed by either forming a Doji or a small-bodied candle.
A Doji candle is a candle where the open and the close are around the same point and typically reflect uncertainty from traders.
Key levels to monitor below price is $0.295 which was marked out on the longer term weekly timeframe. Any drops below this point have met buyer liquidity around $0.277, so this is also an area to watch.
The first area of resistance to monitor is $0.336 where the price has found resistance on numerous occasions.
A triangle pattern has also been forming on the daily chart with both higher lows and lower highs forming.
However, the pattern closely resembles a descending triangle pattern which assigns higher odds of a bearish movement.
A descending triangle pattern is a bearish trend continuation pattern that forms from a support line and a series of lower highs.
Key takeaways: XLM is the top performer among major cryptocurrencies over the past 24 hours. An ascending triangle pattern has been forming for XLM which could be playing into its outperformance. XRP has been consolidating for two months and has been forming a triangle pattern. The triangle pattern closely resembles a descending triangle pattern giving higher odds of a downward movement from here. Latest Ripple & Stellar News:Ripple’s XRP & Binance Coin [BNB] Analysis – XRP Reverses Coinbase Listing Gains
Binance Coin Versus Stellar Lumens – BNB Overtakes XLM to Become Eighth Largest Cryptocurrency
DISCLAIMER: Investing or trading in digital assets, such as those featured here, is extremely speculative and carries substantial risk. This analysis should not be considered investment advice, use it for informational purposes only. Historical performance of the assets discussed is not indicative of future performance. Statements, analysis, and information on blokt and associated or linked sites do not necessarily match the opinion of blokt. This analysis should not be interpreted as advice to buy, sell or hold and should not be taken as an endorsement or recommendation of a particular asset.Ripple’s XRP & Stellar Lumens – XRP Continues to Consolidate As XLM Outperforms was originally found on Cryptocurrency News | Blockchain News | Bitcoin News | blokt.com.
origin »Bitcoin price in Telegram @btc_price_every_hour
Stellar (XLM) на Currencies.ru
|
|