Price Analysis: BAND dips to $5.20 after altcoin sell-off

Price Analysis: BAND dips to $5.20 after altcoin sell-off
фото показано с : coinjournal.net

2020-11-26 16:06

Band Protocols’ token BAND has flashed a sell signal on the daily chart to suggest sell-off pressure could push its price to $3.89

Cross-chain oracle platform Band Protocol’s token BAND is trading lower as widespread crypto sell-off bleeds most altcoins.

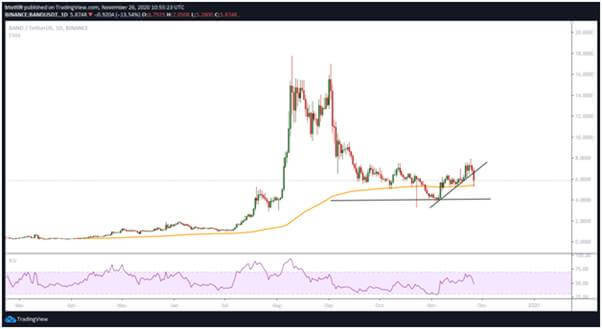
At the time of writing, the BAND token was trading at $5.84 and likely to head lower if bears maintain the downward pressure. The sell-off currently sees Band Protocol’s price printing the third straight red candle on the daily time-frame.

The negative outlook is even more ominous for Band Protocol bulls given the sell signal formed on the daily chart. The TD Sequential indicator suggests the current downswing is likely to push BAND/USD even lower this time. The last time the daily chart flashed the nine green candle, the token’s price crashed from highs of $17.00 to $8.00.

BAND/USDT daily chart. Source: TradingView

In addition to the bearish signal of the TD Sequential, the Relative Strength Index on the daily chart is pointing south to suggest bears still have the upper hand. Also, the token is trading below a short term rising trendline formed since early November.

The above scenario suggests that if the downward pressure holds, the next move down could be a dip to lows of $3.89.

However, bulls might still recover if they keep prices above the 200-day exponential moving average (EMA). Currently, the 200-EMA (daily time-frame) is at the $5.40 level, which is above the base that has held for the past several weeks.

As such, keeping the support zone intact should be the bulls’ primary goal if they wish to avoid more damages. As noted above, the sell signal portends doom for BAND/USD if the price breaks below the support provided by the said moving average.

BAND/USD 4-hour chart. Source: TradingView

On the 4-hour chart, the RSI is climbing after flipping before hitting oversold territory. The MACD suggests a hidden bullish divergence as shown by the green candle in the last session.

This suggests that an influx of upside pressure from traders looking to buy the dip could push Band Protocol up. If this happens, the next hurdle on the upside is the 50% Fibonacci retracement ($6.70) and then 61.8% Fibonacci ($7.46) of the move from highs of $9.83 to $5.14.

The post Price Analysis: BAND dips to $5.20 after altcoin sell-off appeared first on Coin Journal.

origin »

Bitcoin price in Telegram @btc_price_every_hour

Band Protocol (BAND) на Currencies.ru

$ 0 (+0.00%)
Объем 24H $0
Изменеия 24h: 0.00 %, 7d: 0.00 %
Cегодня L: $0 - H: $1.1934
Капитализация $0 Rank 99999
Цена в час новости $ 5.5666 (-100%)

band price altcoin sell-off dips analysis chart

band price → Результатов: 98


Фото:

Bitcoin to Peak above $140,000 in Next Bull Market: Analysis

The next Bitcoin parabolic rally may take prices as high as $141,173, based on logarithmic band analysis. But the trek to those highs may take a while testing various support levels. Bitcoin Price Prediction Based on Previous Bands Charted Forward Analysis by Benjamin Cowen based this prediction on a backward look at BTC performance so far, especially in relation to the halvings of the block reward.

2019-12-21 14:55


Holochain (HOT) Price Prediction for 2019 And Beyond: HOLO The Blockchain Killer To Keep Rising (Early May Update)

Early May update: Technicals The move up we predicted last time we analyzed Holo materialized only slightly as the move up was very limited and quickly lost steem. Right now, HOTBTC chart keeps drifting along the downward trendline (blue line) and the bottom band of the Bollinger bands which serve as the support zone.

2019-5-4 00:58


Holochain (HOT) Price Prediction for 2019 And Beyond: HOLO The Blockchain Killer To Keep Rising (Late April Update)

Late April update: Technicals The move up we predicted last time we analyzed Holo materialized only slightly as the move up was very limited and quickly lost steem. Right now, HOTBTC chart is hitting the downward trendline (blue line) and the bottom band of the Bollinger bands which should serve as the support and rebound […] The post Holochain (HOT) Price Prediction for 2019 And Beyond: HOLO The Blockchain Killer To Keep Rising (Late April Update) appeared first on CaptainAltcoin.

2019-4-26 17:07


Фото:

Bitcoin Price Analysis: Upward Drift Continues Following Established Macro Support

Since mid-February, the bitcoin market has continued to drift upward toward a band of strong, macro resistance (shown below as a red band). This slow, drift upward marks our fourth test of the resistance zone and, unlike the three prior tests, our rejection of the level has shown a weakness on the side of the bears:Figure 1: BTC-USD, Daily Candles, Fourth RejectionIf we compare the three prior rejections (labeled 1, 2 and 3), we see that the move into this resistance level was violent — and had equally violent rejections.

2019-3-29 02:21


Фото:

Bitcoin Price Analysis: Slow Upward Drift Tests Market Supply

A slow, grinding upward drift has been the name of the game for bitcoin’s market over the last few weeks. The upward drift is bringing us slowly to a level that was previously rejected violently:Figure 1: BTC-USD, Daily Candles, Upward DriftOur third rejection of the red resistance level shown above brought the market into a test of macro support in the mid-$3,000s.

2019-3-23 01:23