2022-10-22 20:57 |
The S&P 500 and Bitcoin bounced off their nearby support levels, indicating that the bulls have not given up and are possibly buying the dips.
Similar to Notcoin - Blum - Airdrops In 2024
2022-10-22 20:57 |
The S&P 500 and Bitcoin bounced off their nearby support levels, indicating that the bulls have not given up and are possibly buying the dips.
Similar to Notcoin - Blum - Airdrops In 2024
Bitcoin and altcoins continue to face selling at higher levels, indicating that the bears are not willing to let go of their advantage.
2022-4-16 18:30 | |
btc, NEAR, FTT, ETC and XMR are attempting to rebound off their strong support levels, indicating buying on dips.
2022-4-12 22:20 | |
XRP's price breached its three-month consolidation pattern on 27 March, indicating the start of a massive run-up. Investors can jump on this bandwagon and ride it to crucial levels before booking profThe post XRP's price can nearly double if these levels are cracked appeared first on AMBCrypto.
2022-3-29 19:30 | |
Bitcoin (BTC) continues to decline from key resistance levels, indicating a loss of short-term momentum. Support around $37K-$40K remains intact, which could stabilize the down move. On the weekly chart, conditions are still neutral, benefitting short-term trades.
2022-3-5 22:12 | |
Bitcoin and most major altcoins are attempting a recovery from their strong support levels, indicating that traders continue to buy on dips.
2021-12-31 18:20 | |
Bitcoin and most major altcoins have risen from their respective support levels, indicating an improving sentiment.
2021-12-28 20:30 | |
Bitcoin and most major altcoins have turned down from their respective overhead resistance levels, indicating that the short-term sentiment has turned negative.
2021-11-23 22:12 | |
While bitcoin is still hovering around $60-61k levels, ethereum is hitting new all-time highs. The price of ETH rallied above $4,600 on Wednesday and reached a market cap of just under $550 billion.
2021-11-7 09:06 | |
Bitcoin and select altcoins are facing selling at higher levels, indicating that short-term traders may be booking profits after the recent rally.
2021-10-9 21:00 | |
The cryptocurrency market is down by more than 10% over the last two days. Bitcoin came back down to its previous 43-44k levels, and others, as usual, followed its price movements. Fundamentally, there were no changes observed, and we are still on the right track.
2021-9-22 16:01 | |
Hashrate has now recovered to early June levels indicating that miners are coming back online after China’s crackdown.
2021-8-25 05:57 | |
After days of range-bound action, Bitcoin and many altcoins made a strong comeback today, indicating buying at lower levels.
2021-5-1 21:57 | |
Bitcoin and most major altcoins have bounced off their immediate support levels, indicating an increase in bullish sentiment.
2021-4-6 23:21 | |
Bitcoin and most major altcoins are witnessing strong buying at lower levels, indicating the start of a relief rally.
2021-3-2 21:45 | |
The Zcash (ZEC) price fell considerably during the week of August 31 – September 7. The drop caused the price to break down below numerous support levels, possibly indicating that the upward move has ended.
2020-9-8 17:30 | |
Both Reserve Rights (RSR) and TRON (TRX) have broken out from long-term descending resistance lines — possibly indicating that they have begun bullish trends. Reserve Rights (RSR) The descending resistance line and break out for RSR were outlined by cryptocurrency trader @PostyXBT, who stated that : Finally we get a clean breakout[.
2020-6-4 19:31 | |
In the beginning of May, both the XRP/USD and XRP/BTC pairs broke down from important support levels, possibly indicating that the previous upward trend has ended. While the XRP/BTC price had been previously showing signs of weakness, the XRP/USD decrease was more unexpected, possibly occurring as a result of the decrease in the price of […] The post What Does XRP’s Breakdown Indicate for the Future Movement? appeared first on BeInCrypto.
2020-5-13 07:20 | |
LSK/USD Long-term Trend: Ranging Resistance levels: $2. 2000, $2. 4000, $2. 6000 Support levels: $1. 6000, $1. 4000, $1. 2000 The LSK/USD pair is in the sideways trend zone. The coin was trading between the levels of $1.
2019-7-28 10:57 | |
NANO/USD Long-term Trend: Ranging Resistance levels: $2. 0000, $2. 2000, $2. 4000 Support levels: $1. 2600, $1. 2400, $1. 2200 The NANO/USD pair is in the sideways trend zone. The are sloping horizontally indicating that price is in a sideways trend.
2019-7-28 09:04 | |
XZC/USD Medium-term Trend: Ranging Resistance Levels: $12. 0, $13. 0 $14. 0 Support levels: $10. 0, $9. , $8. 0 Yesterday, July 15, the price of Zcoin was in a bearish trend that broke below the 12-day EMA and the 26-day EMA.
2019-7-26 07:11 | |
XZC/USD Medium-term Trend: Ranging Resistance Levels: $12. 0, $13. 0 $14. 0 Support levels: $10. 0, $9. , $8. 0 Yesterday, July 15, the price of Zcoin was in a bearish trend that broke below the 12-day EMA and the 26-day EMA.
2019-7-24 07:41 | |
LSK/USD Long-term Trend: Ranging Resistance levels: $2. 2000, $2. 4000, $2. 6000 Support levels: $1. 6000, $1. 4000, $1. 2000 The LSK/USD pair is in the sideways trend zone. The coin was trading between the levels of $1.
2019-7-21 06:57 | |
NANO/USD Long-term Trend: Ranging Resistance levels: $2. 0000, $2. 2000, $2. 4000 Support levels: $1. 2600, $1. 2400, $1. 2200 The NANO/USD pair is in the sideways trend zone. The are sloping horizontally indicating that price is in a sideways trend.
2019-7-21 06:52 | |
XTZ/USD Long-term Trend: Bearish Resistance levels: $1. 6000, $1. 8000, $2. 0000 Support levels: $1. 2000, $1. 0000, $0. 8000 The XTZ/USD pair was still in downward correction. The 12-day EMA and the 26-day EMA are trending southward.
2019-7-21 06:46 | |
VET/USD Long-term Trend: Ranging Resistance levels: $0. 0080, $0. 0085, $0. 0090 Support levels: $0. 0070, $0. 0060, $0. 0050 The VET/USD pair had been trading in a sideways trend zone. The 12-day EMA and the 26-day EMA are trending horizontally indicating the sideways trend.
2019-7-21 06:43 | |
The Grayscale Bitcoin Trust (GBTC) is trading at a serious premium, which works out to a Bitcoin price of almost $15,000 – indicating that further gains are imminent. ‘Big Money Coming In’ Via GBTC Data from Grayscale’s recent performance placed it trading at $14.
2019-6-25 13:23 | |
LTC/USD Medium-term Trend: Bullish Resistance Levels: $140, $150, $160 Support levels: $130, $120, $110 Yesterday, June 24, the LTC market was still trading below the $140 overhead resistance level.
2019-6-25 07:37 | |
Stellar [XLM-USD] XLM has been undergoing a bearish outlook in the last 24hrs. XLM/USD pair began trading at $0. 1278 (A) and is currently trading at $0. 1271, It has consequently dipped by 1. 31%.
2019-6-25 16:26 | |
The 12-day EMA and 26-day EMA are flattening indicating that price is in a sideways trend. The XRP price fell to the support of the 26-day EMA, this provides another opportunity for the bulls to make an upward move to retest the $0.
2019-6-20 08:59 | |
From the Fibonacci retracement level, the crypto’s price fell to the support of the 0. 50 (50%) Fib. retracement level. The 0. 50 (50%) Fib. retracement is a downtrend zone indicating that the current trend has been reversed.
2019-6-3 15:30 | |
CARDANO (ADA-USD) A bullish outlook is seen in the last 24hrs, this is buttressed by the 7 day MA that is seen above the 21-day MA thus indicating a bullish signal. The RSI is generally seen above the 50 levels reflecting a strong buying pressure.
2019-5-29 00:20 | |
BTC/USD A bearish run is seen at the beginning of the day where price rally was pushed down past resistance (R) to a low of $6759. 83 (B). This was signaled by the 21 day MA crossing over the 7 day MA indicating a bearish signal, placing resistance levels at $7175.
2019-5-13 18:51 | |
The EMAs are trending horizontally as a single line indicating that price is in a sideways trend. On the upside, if the bulls sustain the price above the EMAs, the crypto’s price is likely to retest the $0.
2019-5-4 11:12 | |
BitTorrent Token Price Analysis BitTorrent Token, BTT, is currently recording its seventh consecutive day of price declines. BTT has reached its most oversold levels on the daily RSI since its launch in January indicating that selling pressure is high.
2019-4-25 11:15 | |
Summary:Bitcoin clearly broke upward out of reaccumulation trading that had spent three weeks consolidating sideways. The market has begun to drift into a zone of supply between the $5,700 and $6,000 levels.
2019-4-24 22:22 | |
If the bulls fail to break above the EMAs, the crypto’s price will continue to range in the bearish trend zone. The EMAs are horizontally flat indicating that the price is in a sideways trend. XVG/USD Medium-term Trend: Bearish Resistance Levels: $0.
2019-4-19 10:41 | |
Bitcoin transaction volume has climbed to levels not seen since January 2018, potentially indicating growing adoption of the Bitcoin network. One of the more popular metrics used to gauge the ‘real use’ of a blockchain or dApp is the number of transactions taking place on the platform.
2019-2-25 04:19 | |
ETH/USD Medium-term Trend: Bullish Resistance Levels: $240, $250, $260 Support Levels: $100, $90, $80 Last week the price of Ethereum had been in a sideways trend. The crypto's price had been ranging above the $120 price level in the past one week.
2019-2-18 07:13 | |
BTC/USD Medium-term Trend: Bullish Resistance Levels: $6,800, $6,900, $7,000 Support levels: $3,700, $3,600, $3, 500 Last week the BTC price had been in a sideways trend. The 12-day EMA and the 26-day EMA are trending horizontally indicating the sideways trend.
2019-2-18 06:52 | |
ETH/USD Medium-term Trend: Bearish Resistance Levels: $240, $250, $260 Support Levels: $100, $90, $80 Yesterday, February 5, the price of Ethereum was in a bearish trend zone. Since on February 3, the 12-day EMA and the 26-day EMA were in a horizontal pattern indicating that price was in a sideways trend. Yesterday as the crypto's […]
2019-2-6 09:51 | |
EOS/USD Medium-term Trend: Bearish Resistance levels: $ 6, $7, $8. Support levels: $3, $2, $1. Yesterday, January 16, the price of EOS was in the sideways trend zone. The 12-day EMA and the 26-day EMA were trending horizontally.
2019-1-17 10:12 | |
Finally, after about a week or so of a tight, range-bound market, bitcoin poked right through support. This swift move dropped the price nearly 10% in the span of just a few short hours:Figure 1: BTC-USD, Hourly Candles, 11% DropNot only did this move occur on high spread, it occured on high volume.
2019-1-12 02:21 | |
BTC/USD Medium-term Trend: Bullish Resistance Levels: $6,800, $6,900, $7,000 Support levels: $3,900, $3,800, $3, 700 Yesterday, January 9, the price of Bitcoin was in a bullish trend. The crypto’s price is above the 12-day EMA and the 26-day EMA indicating that price of Bitcoin is likely to rise. The BTC price is still above the […]
2019-1-10 09:01 | |
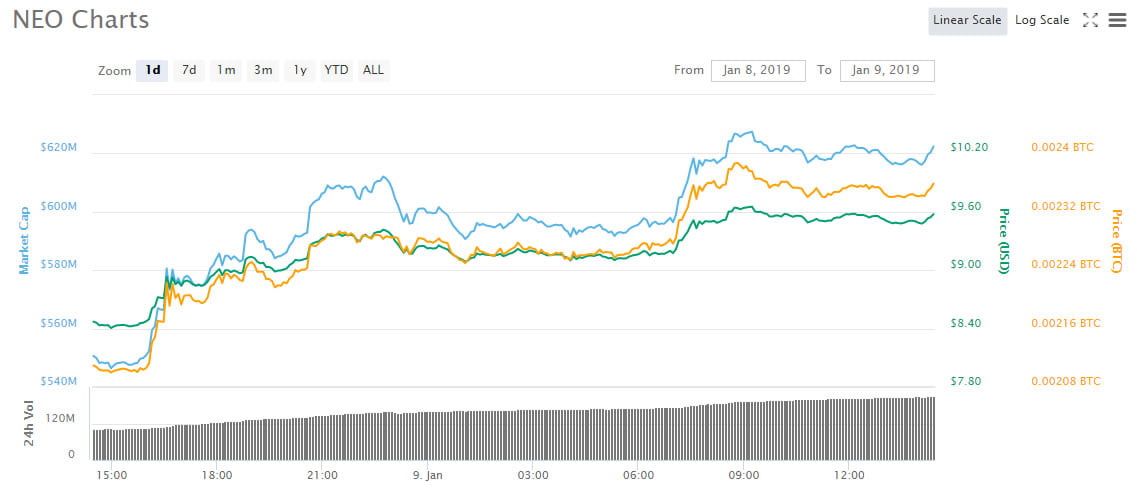
Market Wrap Crypto markets recovering again; NEO on a Roll, Tron and Binance Coin gaining momentum. Another small bounce has taken crypto markets back to Monday’s levels indicating that things are still sideways for the time being.
2019-1-9 11:00 | |
XRP/USD Medium-term Trend: Ranging Resistance Levels: $ 0.61, $0.63, $ 0.65 Support Levels: $0.35, $0.33, $0.31 Last week the XRP price was in a sideways trend. Since on December 29, the 12-day EMA and the 26-day EMA were horizontally flat indicating that XRP price was in a sideways trend. On December 30, the crypto’s price […]
2018-12-31 09:41 | |
ETH/USD Medium-term Trend: Ranging Resistance Levels: $240, $250, $280 Support Levels: $130, $120, $110 Yesterday, December 26, the price of Ethereum was in a sideways trend. The crypto’s price is neither below nor above the 12-day EMA and the 26-day EMA indicating that price is in a sideways trend. The price of Ethereum is still […]
2018-12-27 10:20 | |
BTC/USD Medium-term Trend: Bullish Resistance Levels: $6,800, $6,900, $7,000 Support levels: $4,000, $3,900, $3,800 Yesterday, December 20, the price of Bitcoin was in a bullish trend. The BTC price is making a series of higher highs and higher lows.
2018-12-21 09:56 | |
BTC/USD Medium-term Trend: Bullish Resistance Levels: $6,800, $6,900, $7,000 Support levels: $3,700, $3,600, $3,500 Yesterday, December 19, the price of Bitcoin was in a bullish trend. The price of Bitcoin is above the 12-day EMA and the 26-day EMA indicating that price is likely to rise. The crypto’s price reached the high of $3,950 but […]
2018-12-20 09:01 | |
BTC/USD Long-term Trend: Bearish Resistance levels: $7,200, $7,400, $7,600 Support levels: $4,000, $3,800, $3,600 The BTC/USD pair was bearish in the month of November 2018. The crypto's price is below the 12-day EMA and the 26-day EMA indicating that price is in the bearish trend zone. The digital currency is likely to fall in the […]
2018-12-1 09:28 | |