2019-5-18 16:00 |
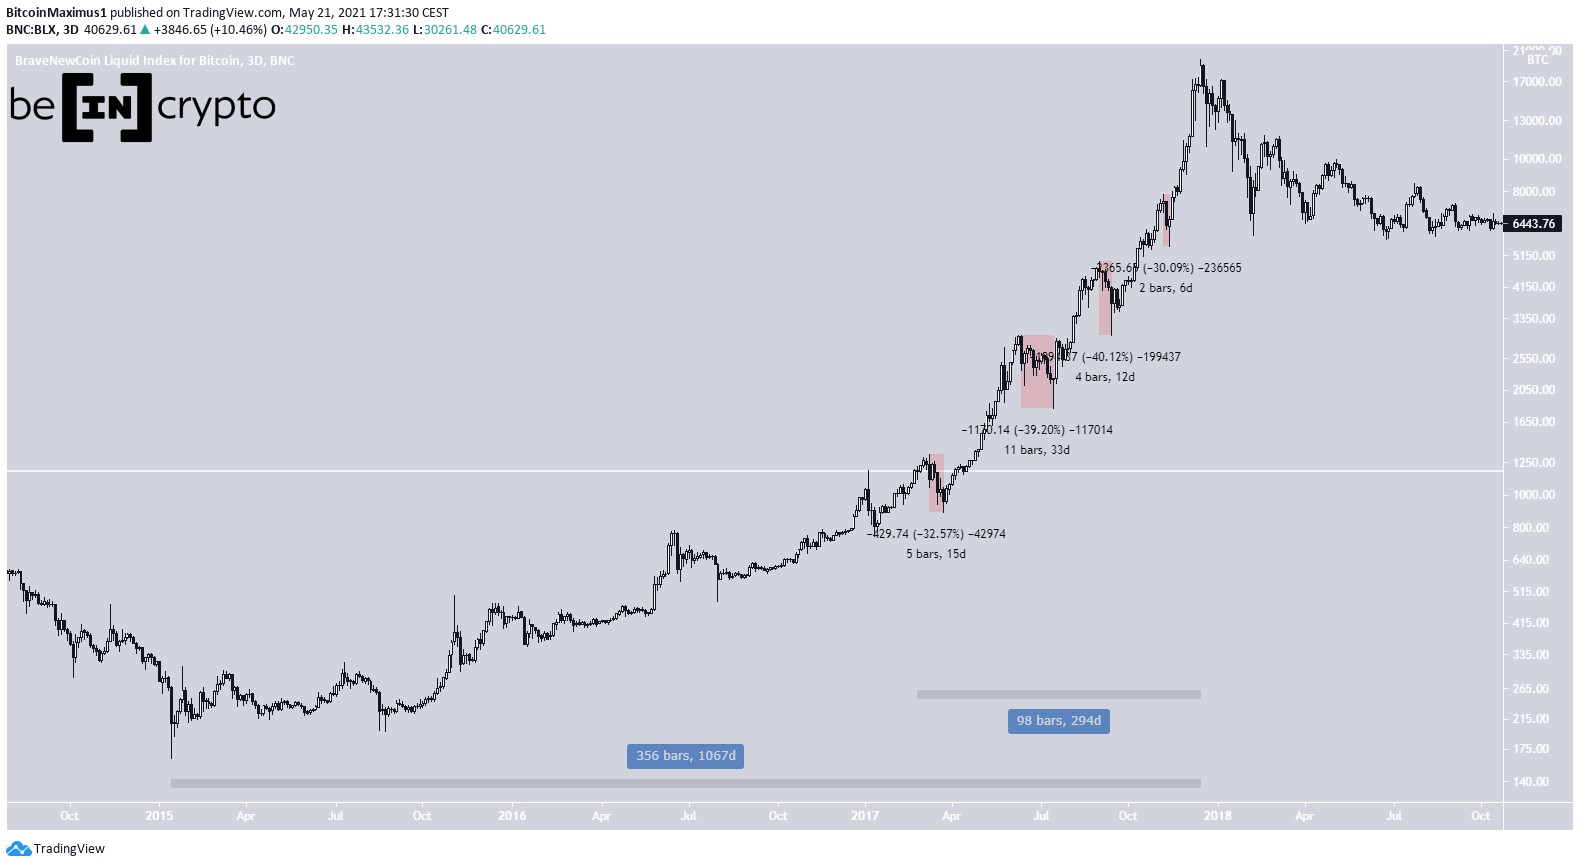
Now that the Bitcoin price has finally flashed signs of an extended bullish run earlier this month, a lot of traders are wondering where things will head next. All one needs to do is look at the previous correction which took over a full year and see how things played out back then. Assuming history will repeat itself as far as the big story is concerned, there will be five minor correction waves users will need to contend with in the foreseeable future.
Correction Wave 1 can Last 16 DaysThe last time Bitcoin went through a major correction prior to 2017-2018-early 2019 was between November 2013 and January 2015. That lengthy correction lasted 411 days and resulted in an 87% Bitcoin price retrace. The most recent trend, which lasted over a full year as well, certainly draws interesting parallels. After that trend came to an end, there was a very long period during which the Bitcoin price moved up slowly and surely. In fact, it went somewhat bullish until May 10th of 2017, when one BTC hit $2,760.1.
After hitting that value, the first wave of a correction kicked in. Another 34% price drop materialized over the span of just over two weeks. This time around, such a massive drop did not occur, albeit it is evident Bitcoin’s downtrend might not be over as of yet. Assuming the current uneasy situation lasts for 16 days as well, there may be some further pressure on the world’s leading cryptocurrency moving forward. If this is the first of five waves, it has lasted just under two days at the time of writing. There is still a lot of work ahead prior to noting a new high.
Correction Wave 2 Should be Brief but ViolentMay of 2017 was not necessarily a good month for Bitcoin. Despite its uptrend still going on at that time, the previous dip had only just resulted in a new high prior to the market collapsing again. A further 33% Bitcoin price drop came into play by May 21st, which could indicate the current price trend may see very similar fluctuations accordingly. Every “breather” usually results in a new high sooner or later, thus there is nothing to be overly concerned about just yet. It will be interesting to see if similar correction waves will materialize throughout 2019.
Correction Wave 3 Tests Wave 2 Support LevelsBetween late May and early June of 2017, the Bitcoin price noted very solid growth after that 33% decline. A new all-time high was noted near the $2,980 level by June 12th, albeit it yielded yet another 39% decline from that day until July 16th. The lowest low during that period was slightly below the previous period’s low, which made a lot of people uneasy. If history were to repeat itself in that regard, there is no telling where things could end up at.
Wave 4 is the Steepest of them AllAlthough these correction waves all show steep declines percentage-wise, wave 4 could be the one making traders and speculators the most money. Last time around, this two-week dip yielded a 40% decline in value, although the Bitcoin price saw plenty of volatile action in the process. Whereas most people assumed this was the beginning of the end, it only took two weeks and a half for Bitcoin to note a new all-time high in the process. One should never discount the world’s leading cryptocurrency, as it is incredibly resilient.
Wave 5 Yielded the Highest Lows of them AllMost technical analysis-oriented traders will know all too well a fifth wave can be rather juicy, for many different reasons. As far as the previous Bitcoin price correction wave 5 is concerned, it yielded a 30% decline, yet only took five days to note a new all-time high. During this period, the price bounced between $7,888 and $5,555.55, which allowed speculators to make a lot of money by flipping BTC back and forth over and over again. Only time will tell if history can repeat itself, but it is relevant information to keep in mind regardless.
Disclaimer: This is not trading or investment advice. The above article is for entertainment and education purposes only. Please do your own research before purchasing or investing into any cryptocurrency.
Image(s): Shutterstock.com
The post 5 Potential Correction Waves to Affect the Current Bitcoin Price Trend appeared first on NullTX.
origin »Bitcoin price in Telegram @btc_price_every_hour
Bitcoin (BTC) на Currencies.ru
|
|


