2024-5-11 15:45 |
Quick Take
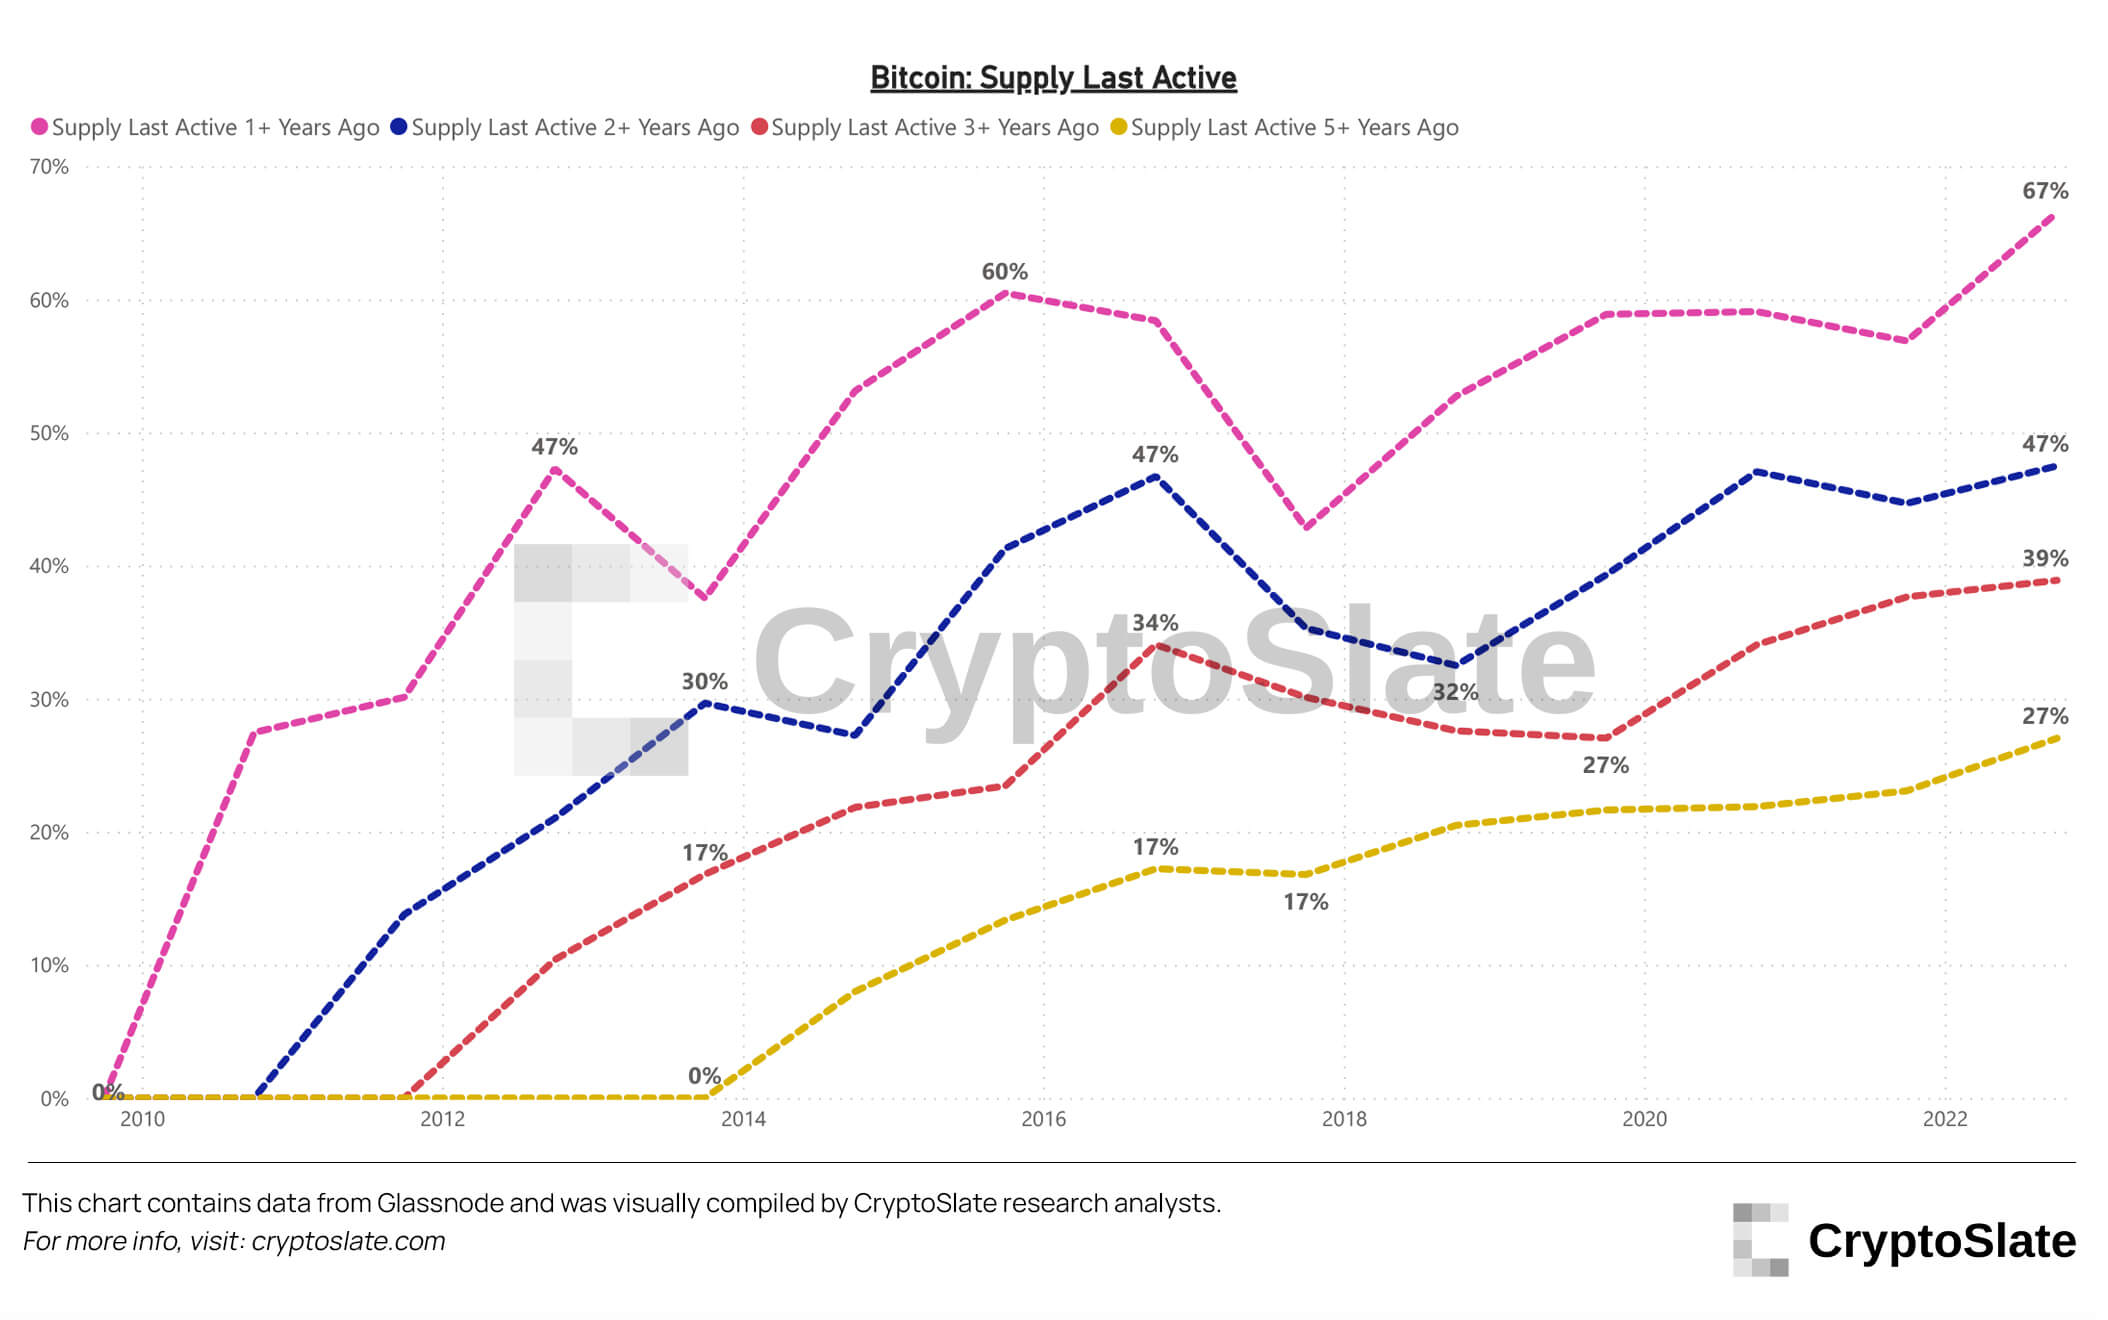
The Glassnode supply last active (SLA) chart overlays multiple cohorts, each representing a percentage of the circulating supply based on the duration since the coins were last active. These cohorts include 1+ years, 2+ years, 3+ years, and 5+ years. As coins are accumulated by long-term holders (LTHs), these metrics tend to rise, reflecting their commitment to holding onto their assets.
Supply Last Active 1yr+ Age Bands: (Source: Glassnode)Data from Glassnode shows that in late 2023, all SLA cohorts reached their all-time highs. However, the US Bitcoin ETF launch and subsequent outflows by GBTC, combined with LTHs selling, led to a temporary decline in the SLA cohorts. Notably, the SLA 1+ year cohort dropped from over 70% to 66%, while the SLA 2+ years cohort fell from over 57% to over 54% and has now plateaued.
Supply Last Active 1yr+ Age Bands, May 2021- May 2024: (Source: Glassnode)Interestingly, the SLA 3+ years cohort, which includes coins held since the start of the 2021 bull run, remained resilient, increasing from over 42% to just over 46%, reaching an all-time high. This suggests that many investors from that period have maintained their positions. Additionally, the upcoming months will provide insights into the behavior of holders who held through the Bitcoin price drop from $50,000 to $30,000 between May and July 2021 during the China mining ban.
The post Over 46% of Bitcoin’s circulating supply hasn’t moved in 3+ years appeared first on CryptoSlate.
origin »Bitcoin price in Telegram @btc_price_every_hour
Supply Shock (M1) на Currencies.ru
|
|


