Pattern - Свежие новости [ Фото в новостях ] | |


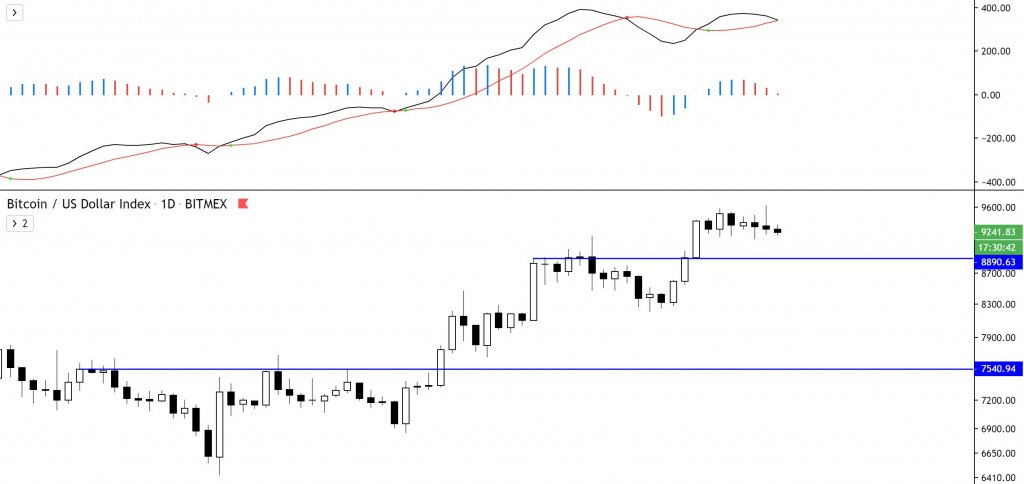
Scary Macro Chart Pattern Shows Bitcoin Could Still Be In Bear Market
Bitcoin has recovered a tiny bit today but it is still in a down trend from the 2020 high. Zooming out reveals a scarier notion and it could be that the bear market still isn’t over. Bitcoin Holding Support BTC has recovered a little since its dump below $8,600 yesterday. дальше »
2020-2-28 10:00 | |
|
|
Bitcoin's fall in price raises questions about its 'Safe Haven' narratives
Several articles have been written about how Bitcoin's price skyrocketed during the US-Iran tensions and the Coronavirus outbreak, but the coin seems to be following a different pattern lately. The kiThe post Bitcoin's fall in price raises questions about its 'Safe Haven' narratives appeared first on AMBCrypto. дальше »
2020-2-28 00:30 | |
|
|
Ethereum (ETH) Price Analysis (February 27)
• Ethereum greatly follows the downward trend pattern as price is now falling towards the support level. • Bearish scenario is playing out in the short-term. ETH/USD Medium-term Trend: Bearish • Resistance levels : $260, $270, $280 • Support levels: $110, $100, $80 Having broken through the support level of $215, hence the beginning of […] дальше »
2020-2-27 07:54 | |
|
|

Ethereum (ETH) Price Analysis (February 26)
• Price now falling towards the support level. • Sellers working hard to invalidate the bullish pattern. ETH/USD Medium-term Trend: Bullish • Resistance levels : $260, $270, $280 • Support levels: $110, $100, $80 Ethereum is in a bullish trend structure in its medium-term outlook. дальше »
2020-2-26 07:24 | |
|
|
XRP Prints Bullish Golden Cross Pattern But Analyst More Concerned About Weekly Death Cross
On Feb. 15, XRP went above $0. 340, a level that was last seen in early July 2019. But as Bitcoin takes a drop, XRP went down to $0. 262 again, to early February levels. Currently, the third-largest cryptocurrency by market cap is trading at $0. дальше »
2020-2-26 19:57 | |
|
|

TRX’s Bullish Reversal Pattern Reaffirms the Bullish Trend
The TRX price has successfully completed a double bottom, which is considered a bullish reversal pattern. As long as it stays above the $0. 02 area which is now acting as support, we are expecting the price to continue moving upwards. дальше »
2020-2-25 05:18 | |
|
|
Bitcoin Risks Drop to $8.7K as Accurate Fractal Flashes Sell-off Sentiment
Bitcoin is risking massive price declines below $9,000 as a historically accurate fractal indicates traders’ sell-off sentiment. The benchmark cryptocurrency’s tendency to retest the $8,750 level increased after it confirmed a bullish reversal pattern last week. дальше »
2020-2-24 15:00 | |
|
|


This Eerie Pattern Shows Bitcoin Could be on the Cusp of a Massive 100%+ Rally
Bitcoin’s recent price action has made it incredibly unclear as to where the cryptocurrency could be positioned to move next, with its recent drop below $10,000 suggesting that bulls do not have enough strength to surmount the resistance that exists around this price level. дальше »
2020-2-22 21:10 | |
|
|

Cosmos (ATOM) Correction Period Might Already Be Over
Since December 27, 2019, the ATOM price has been trading inside a descending wedge. It is currently in the process of breaking out of this pattern. Cosmos (ATOM) Highlights There is resistance at 50,000 and 65,000 satoshis. дальше »
2020-2-21 16:10 | |
|
|
Trading Veteran Says XRP Is Forming a Major Reversal Pattern
Ripple’s XRP went through a steep bull rally since the beginning of 2020 that saw its price surge by nearly 90%. Now, it seems the token has reached exhaustion and...The post Trading Veteran Says XRP Is Forming a Major Reversal Pattern appeared first on Crypto Briefing. дальше »
2020-2-20 15:19 | |
|
|

Bitcoin’s 10% Flash Crash May Actually Satisfy This Bullish Chart Pattern
Bitcoin didn’t fare too well on Wednesday. After recovering to $10,300 from the weekend’s low of $9,500 — a gain of just over 8% — the price of the leading cryptocurrency fell off a cliff as the day came to a close on Wednesday. дальше »
2020-2-20 12:11 | |
|
|
This weird Bitcoin pattern suggests Wednesday’s 10% dump may precede a massive surge
Over the past few days, all anyone could talk about on Crypto Twitter was the golden cross that had formed on Bitcoin’s one-day chart. For those unaware, a traditional golden cross in technical analysis is when an asset’s 50-day simple moving average crosses above its 200-day moving average, suggesting that a decisive bull trend is […] The post This weird Bitcoin pattern suggests Wednesday’s 10% dump may precede a massive surge appeared first on CryptoSlate. дальше »
2020-2-20 12:00 | |
|
|
Fresh 2020 Highs Inbound: XRP Paints Highly Bullish Technical Pattern
This past week XRP saw an incredibly bearish retrace after struggling to maintain its position within the lower-$0. 30 region, with its drop from its 2020 highs of $0. 34 leading the crypto to plummet all the way to lows of $0. дальше »
2020-2-20 02:00 | |
|
|

No, Ethereum Didn’t Just Print an Extremely Bearish Double Top Pattern
On Tuesday, the crypto market mounted a strong recovery, with the prices of Bitcoin, Ethereum (ETH), and other digital assets strongly bouncing off the weekend lows. At Tuesday’s local peak, BTC was trading 8. дальше »
2020-2-20 00:21 | |
|
|
Analyst Prices Bitcoin at $400k By Next Year Based on Miner Capitulation Pattern
The Bitcoin Performance Since Difficulty Bottom chart shows the formation of a cup pattern peaking in spring 2021. This price prediction tool puts Bitcoin at an astonishing $400k by then. #bitcoin $10k … it's getting really interesting now pic. дальше »
2020-2-19 16:26 | |
|
|
This Pattern Suggests Ethereum’s Rally is Far from Over; Here’s How High It May Go
It’s no secret that Ethereum has been one of the best performing major altcoins of 2020, with its rally turning parabolic after it broke above $200. This parabolic rally – which occurred over the span of roughly two weeks – allowed ETH to surge as high as $290. дальше »
2020-2-19 02:00 | |
|
|
Bitcoin to See a Massive Trend-Defining Movement Because of This Simple Pattern
Following yesterday selloff that sent Bitcoin down to lows of $9,500, the cryptocurrency’s buyers have been able to absorb the intense selling pressure and push BTC higher, with it finding some decent stability within the upper-$9,000 region. дальше »
2020-2-19 00:00 | |
|
|
Bitcoin Risks Massive Plunge even amidst Golden Cross Setup; Here’s Why
Is the price of bitcoin preparing for a massive price rally ahead? Many traders believe so. The optimistic sentiments emerge owing to a potentially bullish factor. The bitcoin’s 50-daily moving average this Tuesday inched above its 200-daily moving average, a pattern known as Golden Cross. дальше »
2020-2-18 15:00 | |
|
|
Mind the Gap: Why ETH Price and DeFi Adoption Aren’t in Sync
Demand for DeFi lending services built on ethereum shows a pattern of inverse relationship to the price of ETH. When ether prices are falling, the amount of ETH locked in DeFi tends to rise. Most recent data indicate the relationship operates the other way, too. дальше »
2020-2-18 12:20 | |
|
|
TRONIX (TRX) Price Analysis (February 15)
• The overall outlook of the cryptocurrency is in an uptrend. • Traders may consider buying with bullish reversal candlestick pattern as confirmation. TRX/USD Medium-term Trend: Bullish • Resistance levels : $0. дальше »
2020-2-15 09:00 | |
|
|
TRON (TRX) Price Analysis (February 15)
• The overall outlook of the cryptocurrency is in an uptrend. • Traders may consider buying with bullish reversal candlestick pattern as confirmation. TRX/USD Medium-term Trend: Bullish • Resistance levels : $0. дальше »
2020-2-16 09:00 | |
|
|
Bitcoin to Form Golden Cross but It Cannot Guarantee a Bull Run
Bitcoin traders are enthusiastic about a textbook technical indicator whose formation could send the asset’s prices higher. Dubbed as Golden Cross, the candlestick pattern will occur when bitcoin’s short-term moving average closes above its long-term moving average. дальше »
2020-2-14 18:00 | |
|
|

Ex-Coinbase CTO Argues Bitcoin Will Likely Hit $100,000 Using Coronavirus Spread Pattern
The comparison might appear a bit out-of-place at a casual glance, but an ex-Coinbase CTO believes there are similarities between the underlying pattern of the latest Bitcoin price surge and that of the menacing coronavirus outbreak. дальше »
2020-2-14 16:10 | |
|
|


Is a Stellar (XLM) Breakout Imminent?
The Stellar (XLM) price has been trading inside of an ascending triangle for slightly more than a month. A breakout from this pattern is expected in the near future. Stellar (XLM) Price Highlights The XLM price is trading inside an ascending triangle. дальше »
2020-2-13 06:48 | |
|
|
This Technical Pattern Indicates Bitcoin Could Soon Surge Past $11K
Bitcoin price revered losses and climbed to a new 2020 high at $10,406 against the US Dollar. BTC is now eyeing another bullish wave above $10,500 in the near term. Bitcoin is gaining bullish momentum above the $10,000 and $10,200 resistance levels against the US Dollar. дальше »
2020-2-12 08:18 | |
|
|
EOS and Cardano Formed a Golden Cross, Signals Further Advance
EOS and Cardano have had a similar price action thus far this year. Both of these cryptocurrencies saw the formation of a major bullish pattern around the same time while...The post EOS and Cardano Formed a Golden Cross, Signals Further Advance appeared first on Cryptocurrency News. дальше »
2020-2-11 15:30 | |
|
|
This Simple Pattern Suggests the Recent Crypto Rally is Far from Over
The aggregated crypto market has been caught within a firm uptrend throughout 2020, with all pullbacks being fleeting and followed by further upside. This momentum has largely stemmed from Bitcoin’s recent bullishness, and in the near-term BTC will likely continue to offer guidance to the markets. дальше »
2020-2-11 00:00 | |
|
|
Grin Price Analysis - Bullish signs emerge after a year of decline
At just over a year old, GRIN inflation remains higher than most, if not all, cryptocurrencies in an effort to distribute the coin as widely as possible. However, there is a multi-month double-bottom chart pattern, paired with a reversal of trend metrics, adding to nascent bullish confluence. дальше »
2020-2-10 14:01 | |
|
|

Link Breaks out Towards Its All-Time High Price
On February 5, the Chainlink (LINK) price broke out from an inverse head and shoulders (H&S) pattern and has been increasing since. LINK Price Highlights There is support at 31,500 satoshis. There is resistance at 36,000 satoshis. дальше »
2020-2-9 22:16 | |
|
|

Bitcoin Dominance Rate’s Sharp Decrease Suggests Altseason Has Begun
The Bitcoin dominance rate was rejected strongly at the 72 percent level and has been decreasing since, causing a breakdown from its pattern. Bitcoin Dominance Highlights The Bitcoin dominance rate broke down from a symmetrical triangle. дальше »
2020-2-6 20:30 | |
|
|
Litecoin Forming a Multi-Year Top Pattern May Cause an Epic Plunge
Litecoin, the silver counterpart to Bitcoin as digital gold, is often a leading indicator across the crypto market. If one particular Litecoin chart is accurate, it could be signaling an epic plunge in altcoins against Bitcoin in the coming months. дальше »
2020-2-6 20:03 | |
|
|
Analyst: this pattern shows Bitcoin could be bound for a massive July breakout
The past couple of days have been rocky for Bitcoin (BTC), with the benchmark cryptocurrency facing some notable downwards pressure in the time following its recent rejection at $9,600. It is important to note that the rejection at this level – although bearish over the short-term – may actually throw Bitcoin into a highly bullish […] The post Analyst: this pattern shows Bitcoin could be bound for a massive July breakout appeared first on CryptoSlate. дальше »
2020-2-5 06:00 | |
|
|
Bitcoin Could Fall Hard, This Textbook Indicator Shows
Bitcoin’s dreamy price rally in 2020 could hit a dead end in the coming sessions, according to a bullish reversal indicator. The benchmark cryptocurrency is forming a Rising Wedge pattern as confirmed by its price consolidating between upward sloping resistance and support. дальше »
2020-2-4 18:00 | |
|
|
The Last Time Bitcoin Showed This Formation, It Dropped to $6,000
The bitcoin price rejected $9,500, a multi-year resistance it has been teasing with throughout the past two weeks. The last time it rejected at this level in a similar pattern, it dropped to the $6,000s. дальше »
2020-2-3 12:02 | |
|
|
Bitcoin Defies Gravity: Failed Head And Shoulders Could Trigger Massive Rally
Bitcoin price jumped above the $9,550 resistance to invalidate a key head and shoulders pattern against the US Dollar. It seems like BTC is primed for a massive rally above $10,000. Bitcoin bears failed to push the price below the main $9,150 support against the US Dollar. дальше »
2020-2-3 08:48 | |
|
|
Bitcoin Bulls Alert: This Head & Shoulders Pattern Could Trigger Violent Drop
Bitcoin traded to a new 2020 high at $9,575 and recently corrected lower against the US Dollar. It seems like a head and shoulder pattern is forming, which could drag BTC towards $8,800. After a steady rise, bitcoin price struggled to gain momentum above $9,500 against the US Dollar. дальше »
2020-2-2 08:28 | |
|
|
Key technical pattern suggests Bitcoin’s bear trend is over; levels to watch for
Bitcoin’s firm 2020 uptrend has done more than just put some more money into the pockets of investors, as it now appears that it has fundamentally altered BTC’s market structure, signaling that a reversal of the recent bear market is imminent. дальше »
2020-2-2 05:16 | |
|
|
Litecoin is About to See Exponential Gains Because of This Pattern
Litecoin’s 2020 rally has begun to reach a fever pitch as the crypto shows signs of entering yet another upwards leg that allows LTC to set fresh year-to-date highs. Litecoin’s rally over the past several weeks has allowed it to put significant distance between its recent lows of $50 and its current price of just... The post appeared first on NewsBTC. дальше »
2020-2-2 01:00 | |
|
|
XRP to witness 5% to 6% decline followed by sideways in the next 24 hours
At press time, XRP was stuck in a consolidation pattern. Breaching this could give XRP the break it has been looking for. The price of XRP is currently at $0.24 with a market cap of $10.5 billion and The post XRP to witness 5% to 6% decline followed by sideways in the next 24 hours appeared first on AMBCrypto. дальше »
2020-2-2 22:00 | |
|
|
Bulls Take Control of Litecoin Price Action
Litecoin hit an important milestone in its trend that could catalyze a new rally. However, contrary to the milestone, a technical pattern is signaling exhaustion. Demand for LTC is on the Rise In the last 24 hours, Litecoin experienced a bullish impulse that saw its price surge by 18%. дальше »
2020-1-31 03:49 | |
|
|
Ethereum Pattern Points To Further Underperformance, Despite Bitcoin Rally
The altcoin market recently caught fire after its total market cap and individual crypto assets like Ethereum, Dash, and Litecoin began popping off and breaking through their downtrend resistance lines. дальше »
2020-1-31 20:00 | |
|
|