Engulfing - Свежие новости [ Фото в новостях ] | |


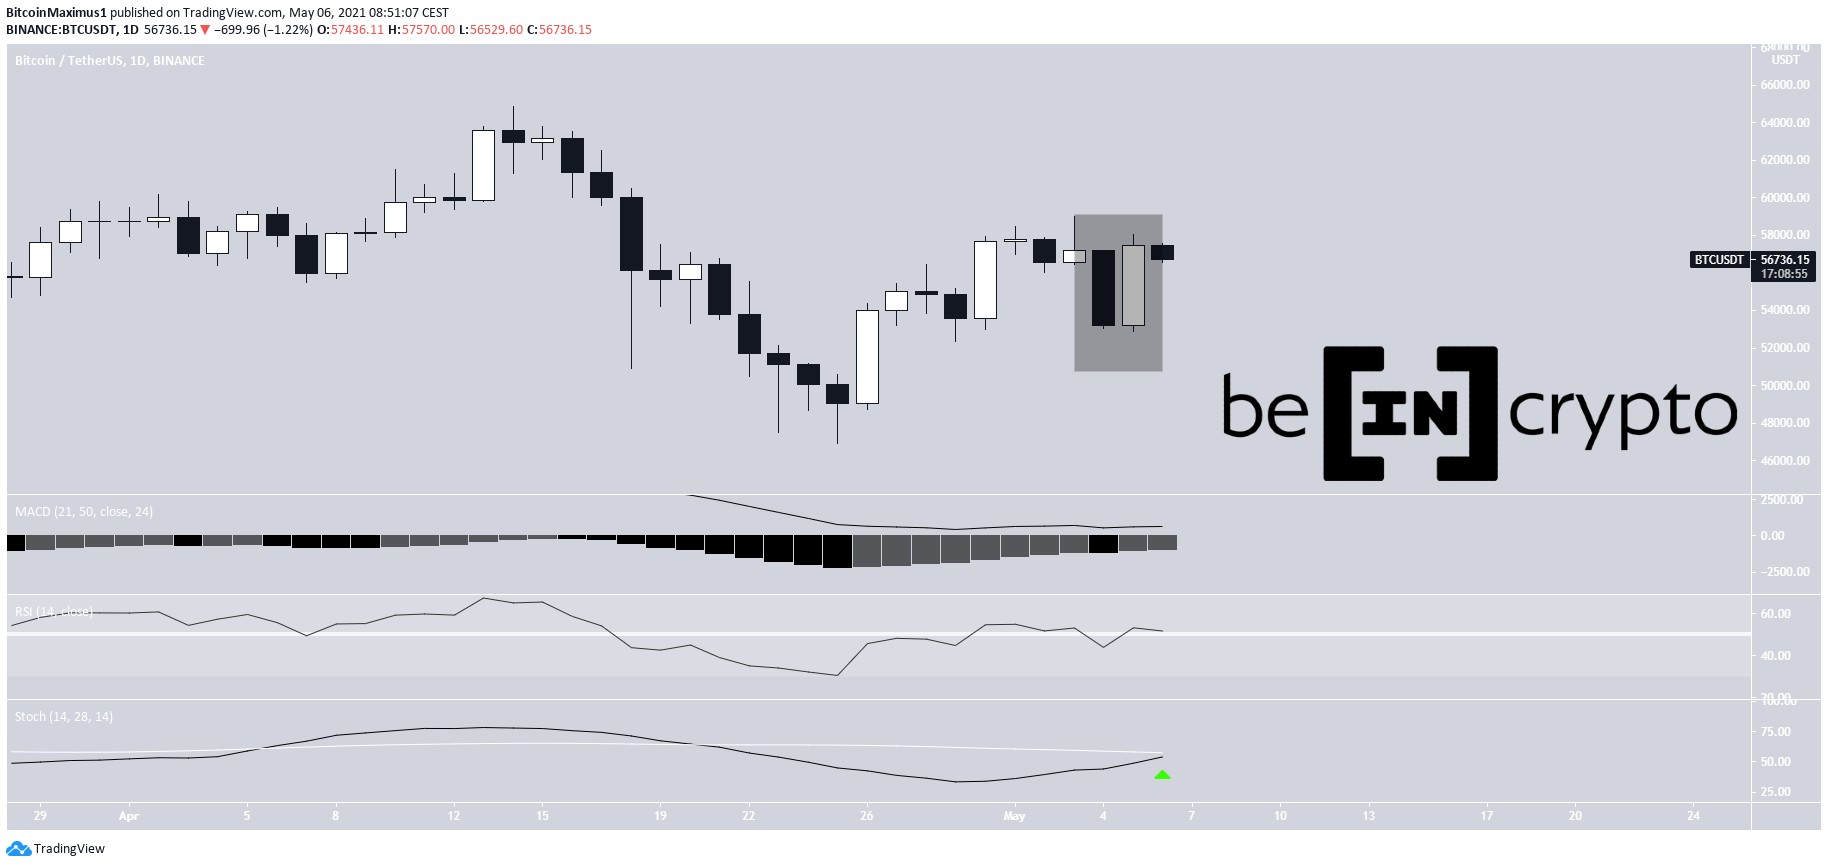
BTC, ETH, XRP, TRX, EOS, XVG, SUSHI—Technical Analysis May 6
Bitcoin (BTC) bounced at the $53,000 support area on May 5, creating a bullish engulfing candlestick in the process. The post BTC, ETH, XRP, TRX, EOS, XVG, SUSHI—Technical Analysis May 6 appeared first on BeInCrypto. дальше »
2021-5-6 14:06 | |
|
|
Bitcoin (BTC) Price Trading Analysis – April 19
After closing the weekly session at $56,280 in a bearish engulfing pattern, down 6% from the previous week, BTCUSD staged an abortive recovery in the early trading hours on Monday. A daily close on Saturday below the key support level of 61165 triggered a rapid, alarming decline on Sunday, leading to roughly $4. дальше »
2021-4-20 21:32 | |
|
|
How Bitcoin Dominance Bullish Engulfing Could Signal An End To Altcoin Season
Bitcoin price is diving currently, shaking up the crypto market as a whole. In addition to the correction in the top cryptocurrency by market cap, altcoins have taken an even more severe beating. With top alts like Ethereum and Litecoin are seeing an even further drop on BTC trading pairs, Bitcoin dominance has formed a […] дальше »
2021-4-8 04:00 | |
|
|
Bitcoin (BTC) Bounces but Fails to Clear Resistance
Nevertheless, Bitcoin is expected to either bounce upwards or consolidate this week. After that, it’s expected to confirm the direction of the longer-term trend. Weekly Bitcoin Close Two weeks ago, Bitcoin decreased considerably and created a bearish engulfing candlestick. дальше »
2021-3-8 12:02 | |
|
|
Bitcoin (BTC) Stops Bleeding with Bounce from Support
It’s possible that this is the beginning of an upward move that will carry Bitcoin above the current resistance range of $50,650-$52,450. Bitcoin Bounces at Support On Mar. 1, Bitcoin bounced at the minor $44,600 support area and created a bullish engulfing candlestick, reaching a high of $49,790. дальше »
2021-3-2 09:39 | |
|
|
Bitcoin (BTC) Bounces Back After Decreasing Below $45,000
Bitcoin is expected to continue increasing towards the resistance areas outlined below. Bearish Weekly Bitcoin Close Bitcoin decreased from a high of $57,508 to a low of $43,000 last week, creating a bearish engulfing candlestick in the process. дальше »
2021-3-1 10:02 | |
|
|
Bitcoin Makes New All-Time High and Nearly Reaches $50,000
While the trend has begun to show signs of weakness, it is likely that BTC will complete another upward move before correcting. Bitcoin Daily Movement On Feb. 11, BTC increased slightly, creating a bullish engulfing candlestick in the process. дальше »
2021-2-12 12:13 | |
|
|
Bitcoin Adds 10% In a Day, Reaches Long-Term Resistance
The Bitcoin (BTC) price created a bullish engulfing candlestick on Nov 5, reaching a high of $15,570 to mark a 10% gain for the day. While the price has reached an important resistance area that could act as the top, there are no signs of weakness yet in the trend. дальше »
2020-11-6 12:44 | |
|
|
Bitcoin Touches New 2020 High Above $13,000 – What’s Next?
On Oct 22, Bitcoin (BTC) continued its ascent by creating a massive bullish engulfing candlestick and breaking out above the $12,050 resistance area. While short-term retracements could occur, it is likely that Bitcoin’s trend is still bullish. дальше »
2020-10-23 11:42 | |
|
|
Bitcoin Sprints Past $12,000 Returning to August Highs
On Oct 20, Bitcoin (BTC) created a bullish engulfing candlestick and proceeded to move above an important resistance area. A daily close above the $12,050 area would be a significant bullish sign, while a weekly close above the current level would be an even more considerable signal for continuation to new 2020 highs. дальше »
2020-10-21 11:43 | |
|
|
XRP Shows Signs of Life With 7% Daily Bounce
The XRP price increased by more than 7% on Oct 4, creating a bullish engulfing candlestick in the process. While the price has yet to break out above the main resistance area, technical indicators and the price action suggest it will do so soon. дальше »
2020-10-5 20:39 | |
|
|
Bitcoin’s Higher Low Paves The Road For Higher Prices
On Sept. 24, the Bitcoin (BTC) price created its first higher low since the Sept. 4 drop with a bullish engulfing candlestick. It is possible that this was the beginning of a new upward movement for BTC. дальше »
2020-9-25 16:48 | |
|
|
What Caused Bitcoin to Drop so Quickly?
On Sept 2, the Bitcoin (BTC) price created a bearish engulfing candlestick and decreased considerably, falling back to the $11,200 support area. While the area is likely to initiate a bounce, BTC could fall towards $10,800 afterward. дальше »
2020-9-3 13:35 | |
|
|
Bitcoin’s Increase: Still Corrective or a New Upward Movement?
The Bitcoin (BTC) price is approaching a decisive daily and weekly close, which will be essential in determining the direction of the next move. Bitcoin’s Candlestick Outlook On Aug. 25, the bitcoin price created a bearish engulfing candlestick that took the price to a low of $11,112. дальше »
2020-8-30 16:16 | |
|
|
Bitcoin Breaks Out Above $12,000 — Legitimate or Fakeout Rally?
On Aug 17, the Bitcoin (BTC) price created a bullish engulfing candlestick and broke out above its previous high. While the breakout looks legitimate, it is not yet clear if there is enough buying power for BTC to continue making higher-highs. дальше »
2020-8-18 12:50 | |
|
|

Analyst Expects Pain for Litecoin as It Paints “Bearish Engulfing Candle”
Litecoin (LTC) has surged 42 percent in a three-week winning streak. But the rally showed signs of exhaustion upon testing a “huge falling resistance” for a breakout. LTC printed a so-called “bearish engulfing candle,” which, according to financial analyst Vince Prince, spells downside risks for the cryptocurrency. дальше »
2020-8-7 16:00 | |
|
|
Bitcoin Retraces Slightly After Suffering Sharp Drop
The Bitcoin (BTC) price decreased considerably on August 2, creating a very significant bearish engulfing candlestick. The price has been increasing since, but the move is more akin to a retracement as a result of the decrease rather than the beginning of a new upward trend. дальше »
2020-8-4 12:48 | |
|
|
Bitcoin Suffers Enormous Drop After Breaking $12,000
The Bitcoin (BTC) price created a massive bearish engulfing candlestick on August 2, possibly indicating that the upward move has ended and a corrective period awaits. The long-term movement, however, still looks healthy. дальше »
2020-8-3 12:18 | |
|
|
Bitcoin Stalls After Steep Upward Move
On July 27, the Bitcoin (BTC) price reached a high of $11,394 after a massive rally. However, the upward move has stalled and the price has been gradually decreasing since. On July 27, the Bitcoin price created a bullish engulfing candlestick, causing the price to reach a high of $11,394, breaking out from the previous […] The post Bitcoin Stalls After Steep Upward Move appeared first on BeInCrypto. дальше »
2020-7-29 13:30 | |
|
|


Bitcoin Reverses After Failed Breakout Attempt
On July 9, the Bitcoin (BTC) price created a bearish engulfing candlestick and fell back inside the descending channel it had just broken out from. This is a sign that the breakout was not legitimate and the price is likely to head lower. дальше »
2020-7-10 12:55 | |
|
|

Bitcoin Attempts to Break Through Crucial $9,300 Resistance
The Bitcoin (BTC) price increased considerably on July 6, creating a bullish engulfing candlestick with considerable volume. This caused the price to move all the way to an important resistance area, a breakout above which would be a major bullish development. дальше »
2020-7-7 12:03 | |
|
|

Bitcoin’s Flash Crash Could Send it to Range Lows
Bitcoin (BTC) decreased considerably on July 2, dropping from a high of $9,255 to $8,940 in a span of fewer than three hours. The decrease also created a bearish engulfing candlestick on the daily time-frame, causing the price to drop below an important moving average (MA). дальше »
2020-7-3 13:45 | |
|
|

Bitcoin Bounces on Crucial Moving Average Yet Again
The Bitcoin price decreased considerably on June 24, creating a bearish engulfing candlestick and erasing almost all of the gains made from the June 22 breakout. However, the price is still trading inside a strong support area backed by the 50-day moving average (MA). дальше »
2020-6-25 13:45 | |
|
|
Bitcoin’s Breakout Has the Price Aiming for $10,000
On June 22, the Bitcoin price created a bullish engulfing candlestick and broke out from a descending wedge that had been in place since the beginning of June. The price reached a high of $9,780 before decreasing slightly to $9,600 where it was trading at the time of press. дальше »
2020-6-23 12:05 | |
|
|

Tezos And Link Break Down From Long-Term Structures
On June 11, the prices of both Tezos (XTZ) and Chainlink (LINK) created bearish engulfing candlesticks that caused breakdowns from their respective long-term ascending support lines. It’s possible that both have just begun a corrective phase. дальше »
2020-6-12 17:32 | |
|
|

Bitcoin Breaks Down from Long-Term Support Line
On June 11, the Bitcoin price created a massive bearish engulfing candlestick, causing the price to break down from the long-term ascending support line it had been following since March 13. It is possible that this was the beginning of a longer-term corrective movement that could knock the price all the way back to $7,000. дальше »
2020-6-12 12:05 | |
|
|

Where Will Bitcoin Find Support?
During the week of May 17-24, the Bitcoin price decreased considerably. It created a bearish engulfing candlestick that caused it to decrease all the way to an important support level. A breakdown below this support could indicate that the price has begun a new bearish trend. дальше »
2020-5-25 14:05 | |
|
|

Is Bitcoin in a Long-Term Bullish Trend?
The Bitcoin (BTC) price has created a weekly bullish engulfing candlestick and moved above a long-term descending resistance line. Weekly Bitcoin Outlook In the weekly chart, the price of Bitcoin (BTC) followed a doji from the previous week by creating a bullish engulfing candlestick. дальше »
2020-5-19 11:36 | |
|
|
Bitcoin Briefly Moves Above $10,000 – What’s Next?
On May 7, the Bitcoin price created a bullish engulfing candlestick, increasing by more than $1,000 throughout the day. This caused the price to move above a descending resistance line that had been in place since December 2017. дальше »
2020-5-8 12:20 | |
|
|
Bitcoin (BTC) Price Analysis (May 7)
Key Highlights • BTC/USD trade has entered another close upper range trading level of $9,500 and $9,000. • BTC/USD bulls may relatively keep pushing against bears in the next trading sessions. • An occurrence of a bearish engulfing candlestick against the past lower highs formed will signal a return of bears in the market. Bitcoin […] дальше »
2020-5-7 10:07 | |
|
|

Crypto Price Analysis May 4: BTC, ETH, XRP, BCH, BSV, LTC, BNB, EOS, XTZ, LINK
The Bitcoin (BTC) price increased considerably during the week of April 27-May 4, creating a weekly bullish engulfing candlestick. However, the price failed to confirm a breakout above a key resistance level. дальше »
2020-5-5 21:15 | |
|
|
Bitcoin Fails to Sustain Prices Above $9,000
During the week of April 27-May 4, the Bitcoin price increased considerably and created a bullish engulfing candlestick. While the price began the week at $7,700, it reached a high of $9,640 before decreasing back below $9,000. дальше »
2020-5-4 13:10 | |
|
|

Bitcoin Surged 4,000% After It Took This Level In 2016. It Just Happened Again
Earlier this week, Bitcoin erupted from $7,700 to $9,500 within the span of just around 24 hours. It was a move that allowed the cryptocurrency to print an extremely strong monthly performance that ended with a bullish engulfing candle. дальше »
2020-5-2 04:04 | |
|
|
Top Technical Analyst Claims Latest Bitcoin Engulfing Candle Isn’t Bullish
Last night’s Bitcoin monthly April candle closed as a bullish engulfing, often considered a reversal candle by traders and analysts. Bulls must beware, however, as one of the most respected top technical analysts recommends not trading this setup when the primary trend is down, as more often than not it leads to another devastating crash.... дальше »
2020-5-1 19:00 | |
|
|

Will Bitcoin Break out Above Its Long-Term Downward Trend Line?
On April 30, the Bitcoin (BTC) price created a bearish candlestick with a very long upper wick that closely resembles a shooting star. This is considered a bearish reversal pattern. The candle was created with more volume than the preceding bullish engulfing one. дальше »
2020-5-1 12:06 | |
|
|

Crypto Price Analysis April 30: BTC, ETH, XRP, BCH, BSV, LTC, BNB, EOS, XTZ, LINK
On April 29, the Bitcoin price created a massive bullish engulfing candlestick, moving above several resistance levels without experiencing any retracement at all. The candlestick had a body of $1,000, an increase of 14% from its opening price. дальше »
2020-5-1 00:15 | |
|
|
Bitcoin Price Working on Monthly Bullish Engulfing: What It Means
Bitcoin price recently exploded from under $7,800 to over $9,400, just twelve full days before the asset’s block reward halving. The powerful push from last month’s extreme low set during Black Thursday, to current levels, has caused a bullish engulfing candle to form on monthly Bitcoin price charts. But what exactly does this mean for... дальше »
2020-5-1 19:00 | |
|
|

Bitcoin Sets Sights on $8,000 after Closing a Higher-High
On April 23, the Bitcoin (BTC) price continued the rally it had begun the previous day, creating another bullish engulfing candlestick in the process. The increase initially went all the way up to $7,738, but dipped back shortly afterward and reached a close at $7,482. дальше »
2020-4-24 13:10 | |
|
|

Crypto Price Analysis April 23: BTC, ETH, XRP, BCH, BSV, LTC, BNB, EOS, XTZ, LINK
On April 22, the Bitcoin price increased considerably, creating a bullish engulfing candlestick in the process. However, it has yet to break out above a crucial resistance level. Until it does so, yesterday’s high is still considered a lower high. дальше »
2020-4-24 19:15 | |
|
|

Bitcoin Struggles to Break out From Its Trading Range
On April 22, the Bitcoin (BTC) price increased considerably from a low of $6818 to a high of $7158. This created a bullish engulfing candlestick. However, the price failed to move above an important resistance level that would otherwise indicate that the current trend is bullish. дальше »
2020-4-23 11:05 | |
|
|

Will Bitcoin Be Able to Move Above this Important Moving Average?
On April 6, the Bitcoin price created a bullish engulfing candlestick and moved above several important resistance levels, including the yearly open. The rally has stalled, however, since reaching the 50-day moving average (MA). дальше »
2020-4-9 11:35 | |
|
|

Bitcoin Smashes Through $7,000 — What’s Next?
On April 6, the BTC price increased considerably, creating a bullish engulfing candlestick to reach a close of $7,355, safely above the resistance of the previous long upper-wick. The next important resistance area is found at $7,750. дальше »
2020-4-7 12:10 | |
|
|

Bitcoin Climbs Back Above $6,000 — But is the Rally Legitimate?
The Bitcoin price increased significantly over the course of the day on March 30. The price opened at $5,880 but created a bullish engulfing candlestick that reached a high of $6,599 and closed at $6,400. дальше »
2020-3-31 11:15 | |
|
|

XRP Fractal Indicates the Beginning of an Upward Move
On March 25, the XRP price briefly decreased below the support line of its long-term trading range. It followed this with a bullish engulfing candlestick the next day. A similar movement that transpired in September 2019 marked the beginning of an upward move with a magnitude of 60%. дальше »
2020-3-28 17:10 | |
|
|