2021-10-13 16:09 |
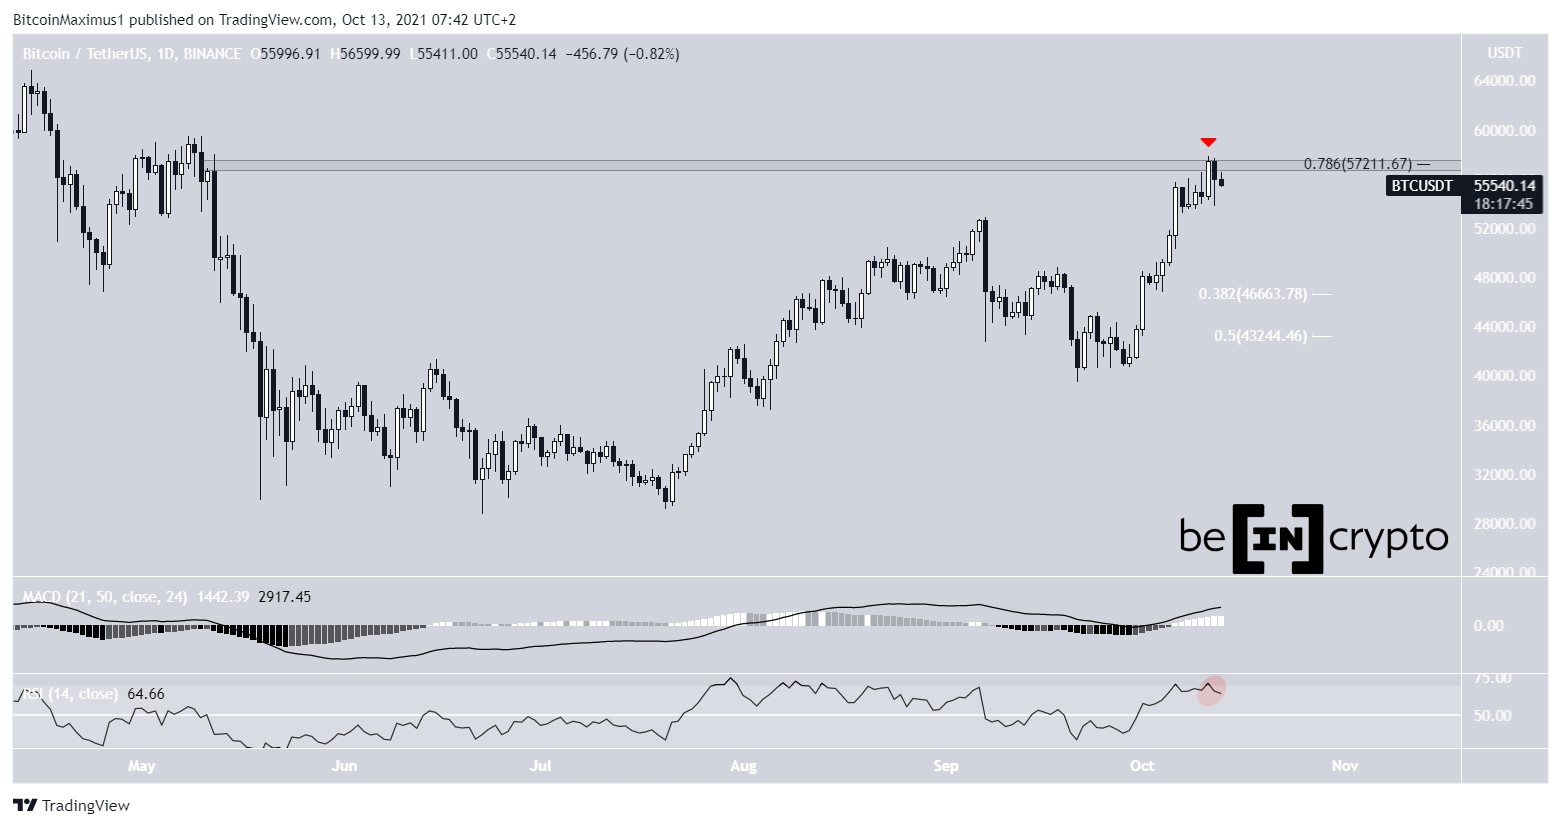
Bitcoin (BTC) was rejected by the $57,200 resistance area.
Ethereum (ETH) and XRP (XRP) have broken out from ascending parallel channels.
Alchemix (ALCX) and Telcoin (TEL) are attempting to break out from descending resistance lines.
Digibyte (DGB) is trading inside a descending parallel channel.
Stacks (STX) has reclaimed the final resistance area prior to a new all-time high.
BTCOn Oct 11, BTC reached a high of $57,839 but fell sharply afterwards. The high was reached inside the $57,200 resistance. This is both a horizontal and Fib resistance level.
The ensuing decrease confirms that the price has been rejected by the $57,200 resistance area, potentially initiating a corrective period.
Technical indicators are showing the first signs of weakness, since the RSI has fallen below 70. The RSI is a momentum indicator, and the decrease below 70 indicates that the trend is losing strength. However, it is still bullish as long as the token is trading above 50.
Chart By TradingView ETHETH has been moving upwards since Sept 1 and broke out from an ascending parallel channel on Oct 1. This signaled that the previous correction had come to an end and the token now began an upward movement.
Afterwards, it validated the resistance line twice on Oct 4 and 11 (green icons). Therefore, the line is now expected to act as support.
As long as the token is trading above this line, the most likely scenario would have it making a breakout attempt above the $3,630 resistance area. The same area previously rejected ETH on Oct 8.
A breakout above it would likely trigger a sharp upward movement.
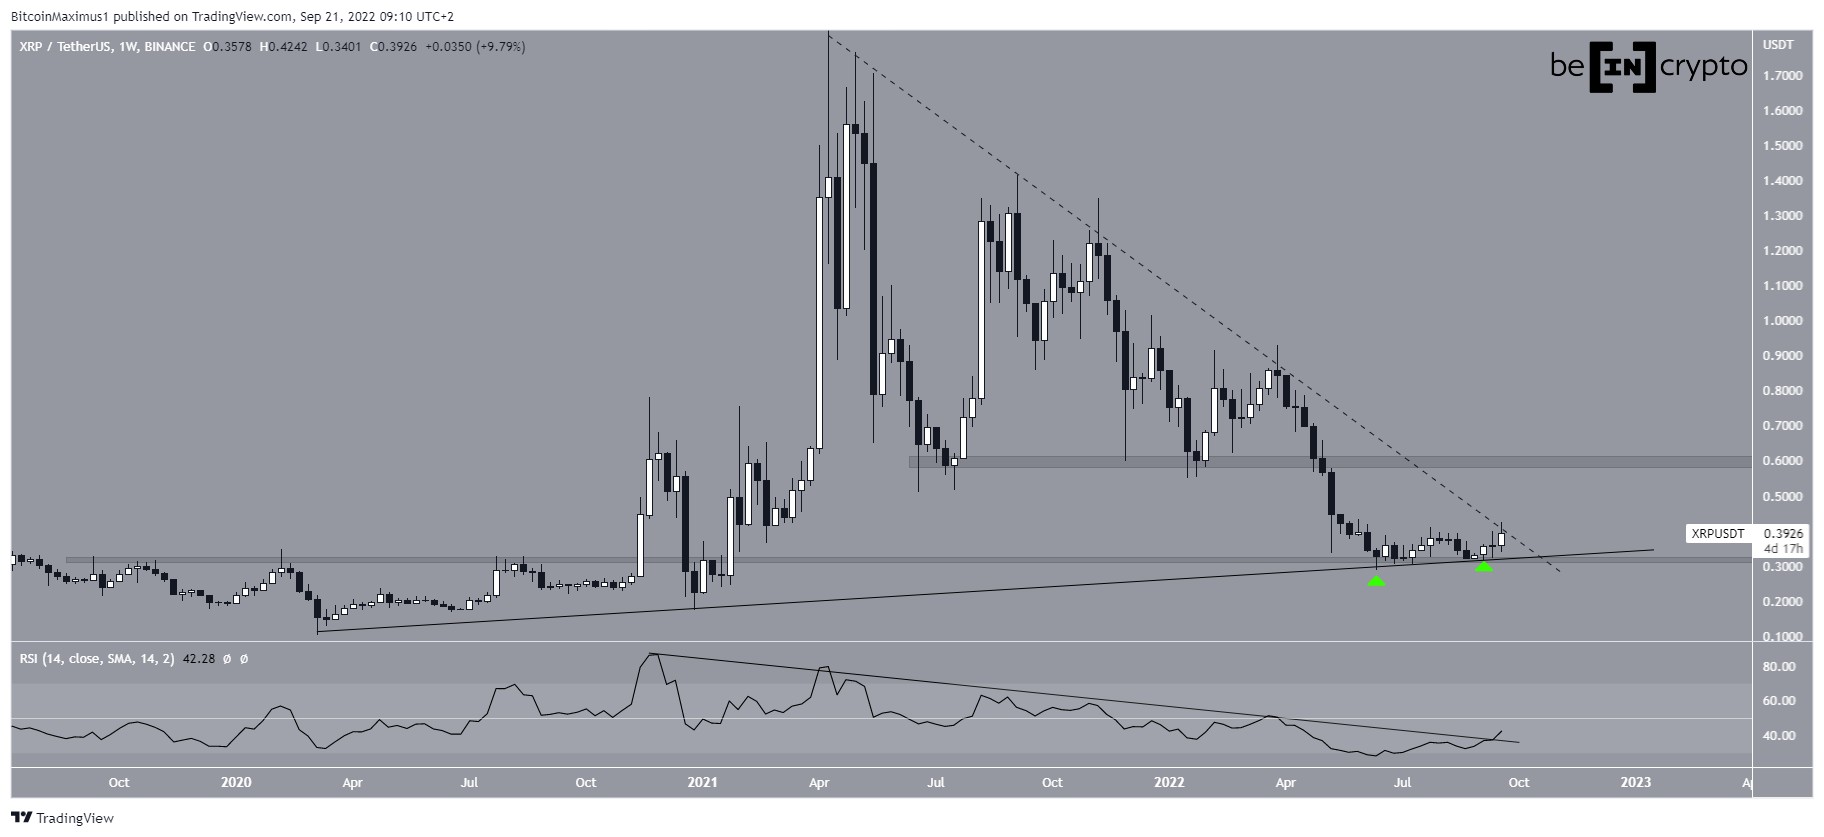
Chart By TradingView XRPXRP broke out from a descending resistance line on Oct 9. This suggested that the ongoing decrease has now ended.
Afterwards, it continued to increase until it reached a high of $1.20. The high was made at the 0.618 Fib retracement resistance level, which is the most common Fib level that acts as resistance after sharp drops.
Despite the rejection, XRP is trading above numerous support levels, created by the previous resistance line and the resistance line of a parallel channel, both of which are now acting as support.
However, there are no bullish reversal signs as of yet.
Chart By TradingView ALCXALCX has been decreasing alongside a descending resistance line since Aug 7. As long as the resistance line is in place, this suggests that the trend is bearish.
On Oct 13, the token was rejected by this resistance line (red icon) and fell sharply, creating a long upper wick. This is a sign of selling pressure, since it means that the higher prices could not be sustained and sellers took over.
If ALCX continues its descent, the closest support area would be at $307. This is the 0.5 Fib retracement support level and the resistance line of a parallel channel from which ALCX broke out previously. Therefore, the level is expected to act as strong support.
An eventual breakout above this line would likely trigger a very sharp upward movement.
Chart By TradingView DGBDGB has been decreasing inside a descending parallel channel since Sept 9. Such channels usually contain corrective movements. This means that the dominant trend is upwards, thus a breakout from the channel will eventually occurs.
The fact that DGB is in the upper portion of the channel further supports this possibility.
If a breakout occurs, the closest resistance area would be at $0.061. This is the 0.5 Fib retracement resistance level and a horizontal resistance area. Therefore, it is expected to act as strong resistance if DGB gets there.
Chart By TradingView TELTEL had been decreasing alongside a descending resistance line since May 21. This was a sign that the trend is moving downwards.
However, the trend seemingly reversed on July 20 and today TEL has created a massive bullish candlestick and is in the process of breaking out. This is a sign that the trend is turning bullish.
If the upward movement continues, there is no distinct resistance area until $0.037.
Chart By TradingView STXSTX has been increasing alongside an ascending support line since June 22. The rate of increase accelerated once the token bounced at this line on Sept 29 (green icon).
On Oct 11, STX reclaimed the $1.95 resistance area. This was crucial since the area is the 0.618 Fib retracement resistance level and the final resistance prior to the all-time high of $2.857.
Therefore, there is no overhead resistance until the all-time high price.
Chart By TradingViewFor BeInCrypto’s latest Bitcoin (BTC) analysis, click here.
What do you think about this subject? Write to us and tell us!
The post Multi Coin Analysis: Telcoin (TEL) surges 25% as Bitcoin Hits Resistance appeared first on BeInCrypto.
origin »Telcoin (TEL) на Currencies.ru
|
|


