Memecoin returns were 6x higher than crypto market average over past 30 days

Memecoin returns were 6x higher than crypto market average over past 30 days
фото показано с : cryptoslate.com

2024-11-18 03:00

Memecoins’ have posted average returns of 103% over the past 30 days — over 6x higher than the crypto market’s 16.1% average return, according to data from Artemis.

Dogecoin (DOGE) and Pepe (PEPE) registered the more significant gains among the 19 memecoins tracked by Artemis during the period, growing 196.1% and 115%, respectively. PEPE’s “beta play” PepeCoin also rose significantly, with a 121.1% gain.

Meanwhile, Solana-based Bonk (BONK) climbed 70.2%, while Base’s Brett (BRETT) saw a 63.5% price increase over the period.

Notably, many memecoins connected to the US elections have crashed in the days following the conclusion of the presidential race, including MAGA (TRUMP), which fell 72% over the past 30 days.

According to market insights platform Kaito AI, memecoins controlled nearly 24% of investors’ mindshare as of Nov. 14. One out of four crypto investors posting on X is discussing memecoins.

Most profitable narratives

Including memecoins, only nine out of the 22 crypto sectors tracked by Artemis beat the market’s 16% monthly average return.

The “store of value” sector, which includes tokens like Dash (DASH), Litecoin (LTC), and Monero (XMR), registered an average gain of 48.2%.

Native tokens of first-generation blockchains focused on smart contract functionality, such as Cardano (ADA) and Ethereum Classic (ETC), trailed closely, leaping 47.1% over the past 30 days.

Meanwhile, smart contract platforms like Solana (SOL) and Sui (SUI) posted average gains of 24.3% and barely outperformed the market’s average return. 

The overall sector’s relatively weaker gains, despite strong performance by SOL and SUI, are primarily the result of the lackluster performance of other tokens in the index, including tomiNet, Celo (CELO), and Optimism (OP) — all of which registered losses over the period.

Tokens related to oracles, DEXs for perpetuals trading, centralized exchanges, and general DeFi applications also beat the market’s average performance, rising 19.1%, 24%, 20.9%, and 20.3%, respectively.

Meanwhile, the real-world assets (RWA) sector performed in line with the market average, recording an aggregated gain of 16.8%.

On the negative performance side, tokens from the AI and social sectors registered negative variations of 1.6% and 4.6%.

Furthermore, data availability sector crashed 14.6% over the past 30 days and was the worst-performing over this period.

The post Memecoin returns were 6x higher than crypto market average over past 30 days appeared first on CryptoSlate.

Similar to Notcoin - Blum - Airdrops In 2024

origin »

Market.space (MASP) на Currencies.ru

$ 0 (+0.00%)
Объем 24H $0
Изменеия 24h: 0.00 %, 7d: 0.00 %
Cегодня L: $0 - H: $0
Капитализация $0 Rank 99999
Доступно / Всего 0 MASP

average past memecoins pepe artemis days market

average past → Результатов: 126


Altcoin Market Cap Surges Past 200-Day EMA: Is Altseason Finally Here?

Several indicators point to renewed strength in altcoins, suggesting a potential altcoin season on the horizon. However, for confirmation, Bitcoin (BTC) dominance needs to drop further. Altcoin Market Cap Crosses 200-Day EMA Crypto analysts are closely monitoring various indicators that track altcoin behavior, with one critical metric being the 200-day exponential moving average (EMA).

2024-9-27 10:30


Bitcoin Traders Sink Into ‘Fear’ As Price Crashes Below $58,000

Data shows that Bitcoin traders’ sentiment has declined into ‘fear’ after the price crash the cryptocurrency has seen during the past 24 hours. Bitcoin Fear & Greed Index Is Now Suggesting A Fearful Market The “Fear & Greed Index” is an indicator created by Alternative that tells us about the average sentiment currently held by traders in the Bitcoin and wider cryptocurrency market.

2024-7-5 06:00


Cardano Whales Drive Surge In Large Transactions Amid Market Volatility

In recent days, Cardano whales have been actively engaged in the cryptocurrency market, conducting an average of $13.84 billion worth of large transactions daily over the past week. This notable volume places Cardano’s transaction activity at one-third of Bitcoin’s current volume, five times higher than Litecoin’s, and over sixteen times […]

2024-5-1 01:24


Short-term holder realized price nears $50,000

Quick Take Realized price, a metric reflecting the collective price at which each coin was last utilized on-chain, experienced significant fluctuations over the past week. The short-term holder (STH) realized price, showing the average on-chain acquisition price for coins moved outside exchange reserves within the past 155 days, is inching towards $50,000 – a notable […] The post Short-term holder realized price nears $50,000 appeared first on CryptoSlate.

2024-3-7 11:30


Фото:

Ethereum Layer-2 Booming: Will Gas Fees Drop Even In A Bull Market?

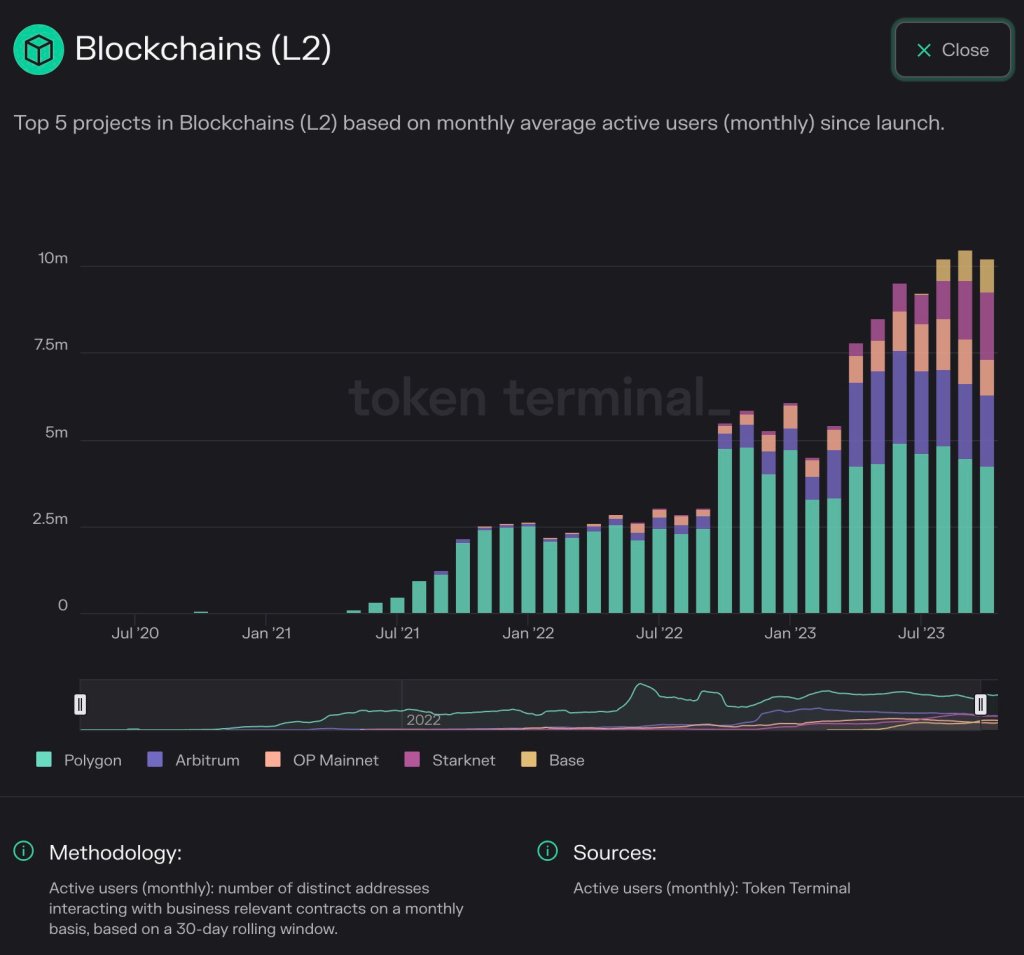
The adoption of Ethereum layer-2s is on the rise if Token Terminal data shared on November 6 is anything to go by. According to statistics from the blockchain analytics platform shared by Erik Smith, the Chief Investment Officer (CIO) of 401 Financial, the average active addresses over the past three months has exceeded 10 million, a nearly 2X expansion from early 2023.

2023-11-7 03:00


Bitcoin Trade Volumes Beat YTD Average As Inflows Resume: Are Bulls Taking Over?

Bitcoin, the world’s largest cryptocurrency, has had a few progress and setbacks in the past year. This has been reflected in digital asset investment products. However, new data shows that while outflows from digital investment products have dominated for another week, Bitcoin has shown some resilience to record a weekly inflow of $3.

2023-9-6 19:00


Bitcoin mining revenue just edges past year-long average

Quick Take Bitcoin miner revenue currently stands at approximately $25. 5 million, marginally surpassing the 365-day Simple Moving Average (SMA) of $22. 5 million. This financial situation draws noteworthy similarities to the pattern seen in 2019 during the previous bear market when the revenue eventually dipped below the 365 SMA, prompting speculations about potential parallels in trends.

2023-8-29 13:00