2024-9-22 15:47 |
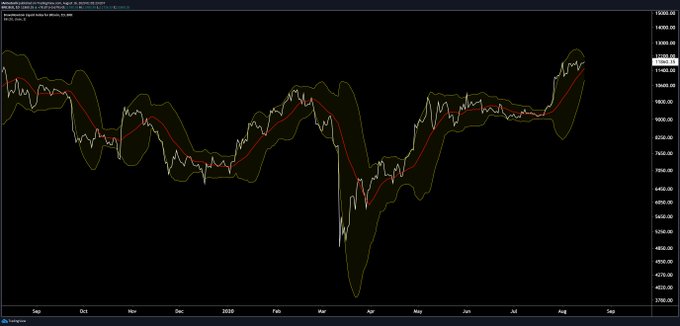
Bollinger Band creator John Bollinger offers insight on current BTC price action origin »
Bitcoin price in Telegram @btc_price_every_hour
Bitcoin (BTC) на Currencies.ru
$ 78724.43 (-0.08% )
Объем 24H $16.564b
Изменеия 24h: 0.49 % , 7d: 1.08 %
Cегодня L: $78080.75 - H: $78840.1
Капитализация $1576.34b Rank 1
Цена в час новости $ 63176.31 (24.61% )
|
|