2024-8-28 19:30 |
Monitoring the supply of Bitcoin held on exchanges is important because significant changes in the metric are very good at reflecting market sentiment. When the supply of Bitcoin on exchanges rises, it indicates that the market is ready to trade and take advantage of short-term opportunities.
Conversely, when Bitcoin has moved off exchanges, it usually indicates that the market is planning to hold onto it for longer, possibly because it believes the price will rise or to protect itself from potential market volatility.
The 30-day change in supply held on exchanges is particularly useful because it shows the longer-term trend of whether investors are generally moving their Bitcoin onto or off of exchanges. This metric smooths out daily fluctuations and gives a clearer picture of the overall direction in which the market is moving.
Since Aug. 15, the net position change of Bitcoin on exchanges has been consistently negative, indicating that more Bitcoin has been withdrawn from exchanges than deposited. It marks a sharp reversal from the period between Jun. 30 and Aug. 14, when the 30-day change in supply held in exchange wallets was positive and suggested an accumulation of Bitcoin on exchanges. The notable drop in net position on Aug. 15, from +27,066 BTC to -22,000 BTC, illustrates a very aggressive shift in strategy.
Chart showing the 30-day change in the supply of Bitcoin held in exchange wallets from June 20 to Aug. 26, 2024 (Source: Glassnode)Bitcoin’s sharp drop from its ATH of $71,000 on Jul. 28 triggered a negative net position change. It could indicate that traders may have reacted to and anticipated further volatility by moving their assets to exchanges, deciding to sit on their BTC rather than trade it. The subsequent price recovery to $62,900 by Aug.26 shows that some investors might have perceived the price drop as an opportunity to accumulate Bitcoin, which is reflected in the ongoing outflows from exchanges.
The range of 20,000 to 30,000 daily transfers from exchanges throughout most of August illustrates the scale of these outflows.
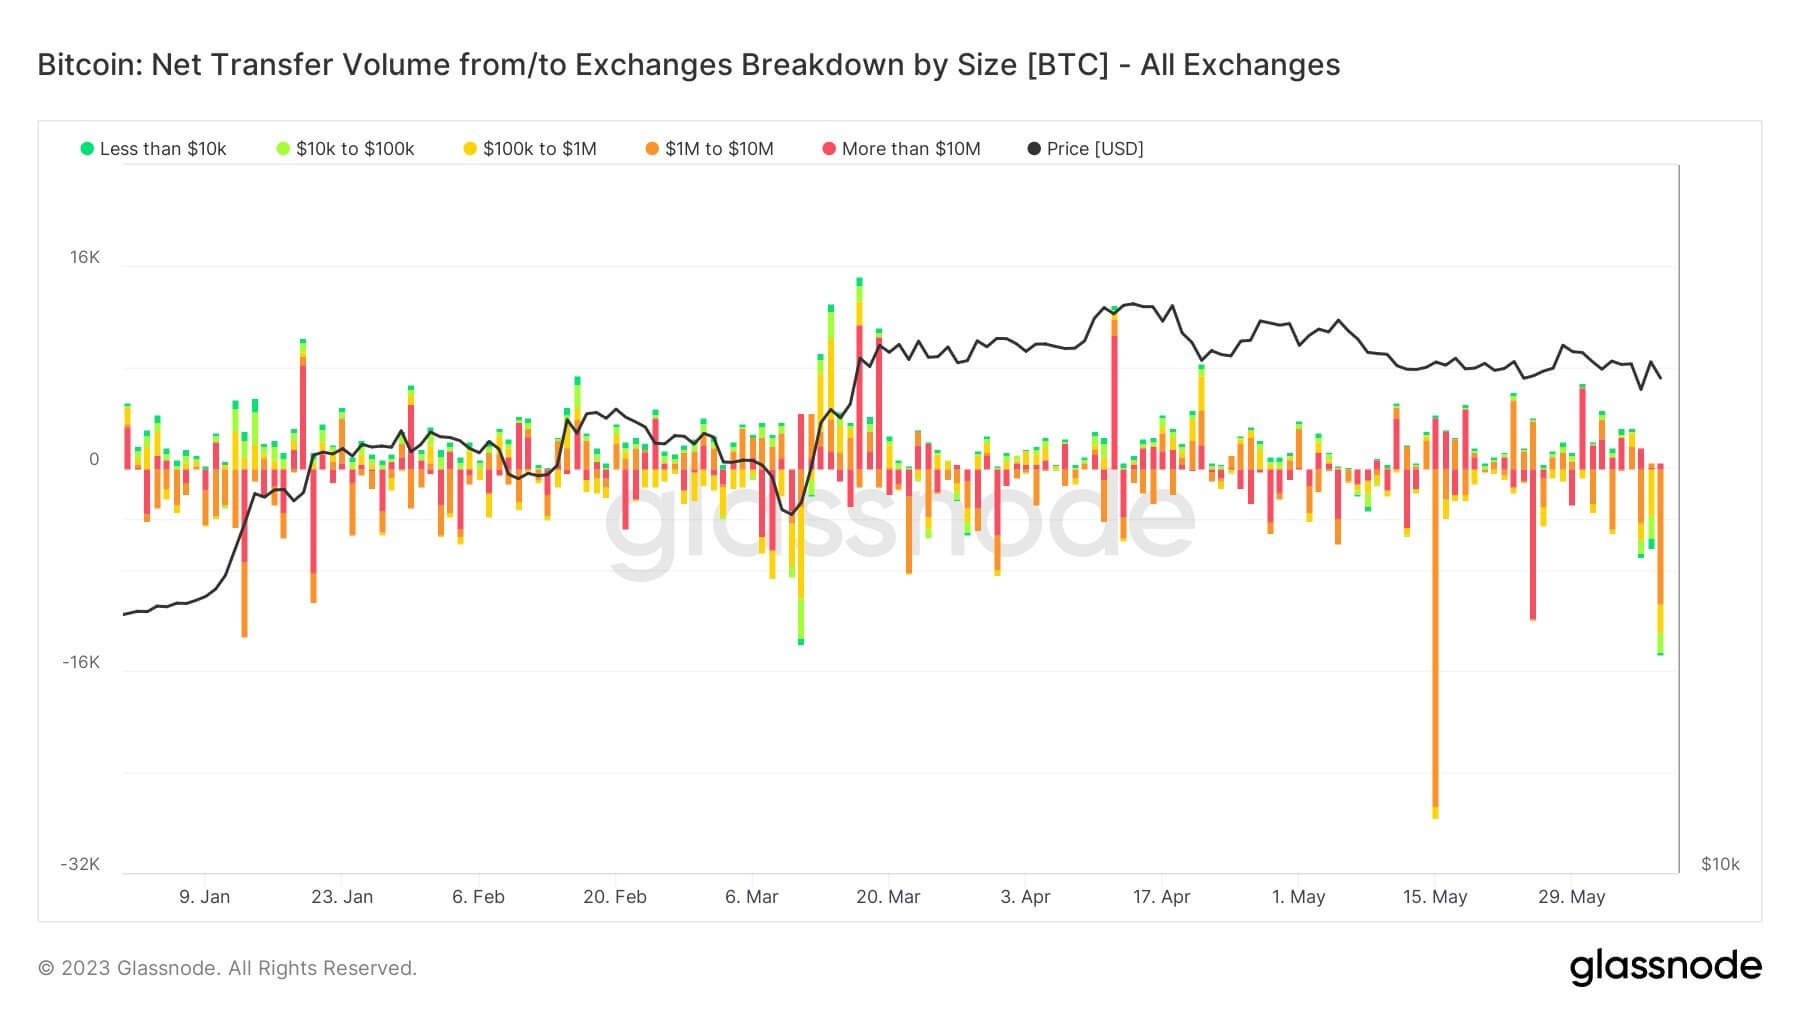
Graph showing the number of on-chain withdrawals from exchanges from July 29 to Aug. 26, 2024 (Source: Glassnode)The breakdown of net flows by the USD value of transactions shows that large holders drove this trend. Data from Glassnode shows that most outflows from exchanges are attributed to transactions ranging from $1 million to $10 million, indicating that institutional players or high-net-worth individuals are likely behind these moves.
Chart showing the net flow of BTC into/out of exchanges by the USD value of the transactions from Aug. 14 to Aug. 26, 2024 (Source: Glassnode)This data collectively points to a market environment where investors, particularly larger ones, are reducing their exposure to potential exchange risks and volatility by moving significant amounts of Bitcoin off exchanges.
The timing of these moves, in conjunction with the price drop, suggests that these investors are reacting to or anticipating market changes, possibly aiming to avoid further losses or positioning themselves for future gains. Despite the price recovery, the continued negative net position change could indicate a cautious market outlook, where investors prefer to hold their assets in private wallets rather than risk leaving them on exchanges.
The post Large transactions drive Bitcoin withdrawal from exchanges appeared first on CryptoSlate.
origin »Bitcoin (BTC) на Currencies.ru
|
|


