2021-1-8 23:57 |
After a significant drop, the XRP price initiated a considerable bounce on Jan. 7, so far increasing by 40%.
However, XRP has yet to reclaim the previous breakdown level at $0.475, and the trend cannot be considered bullish until it does so.
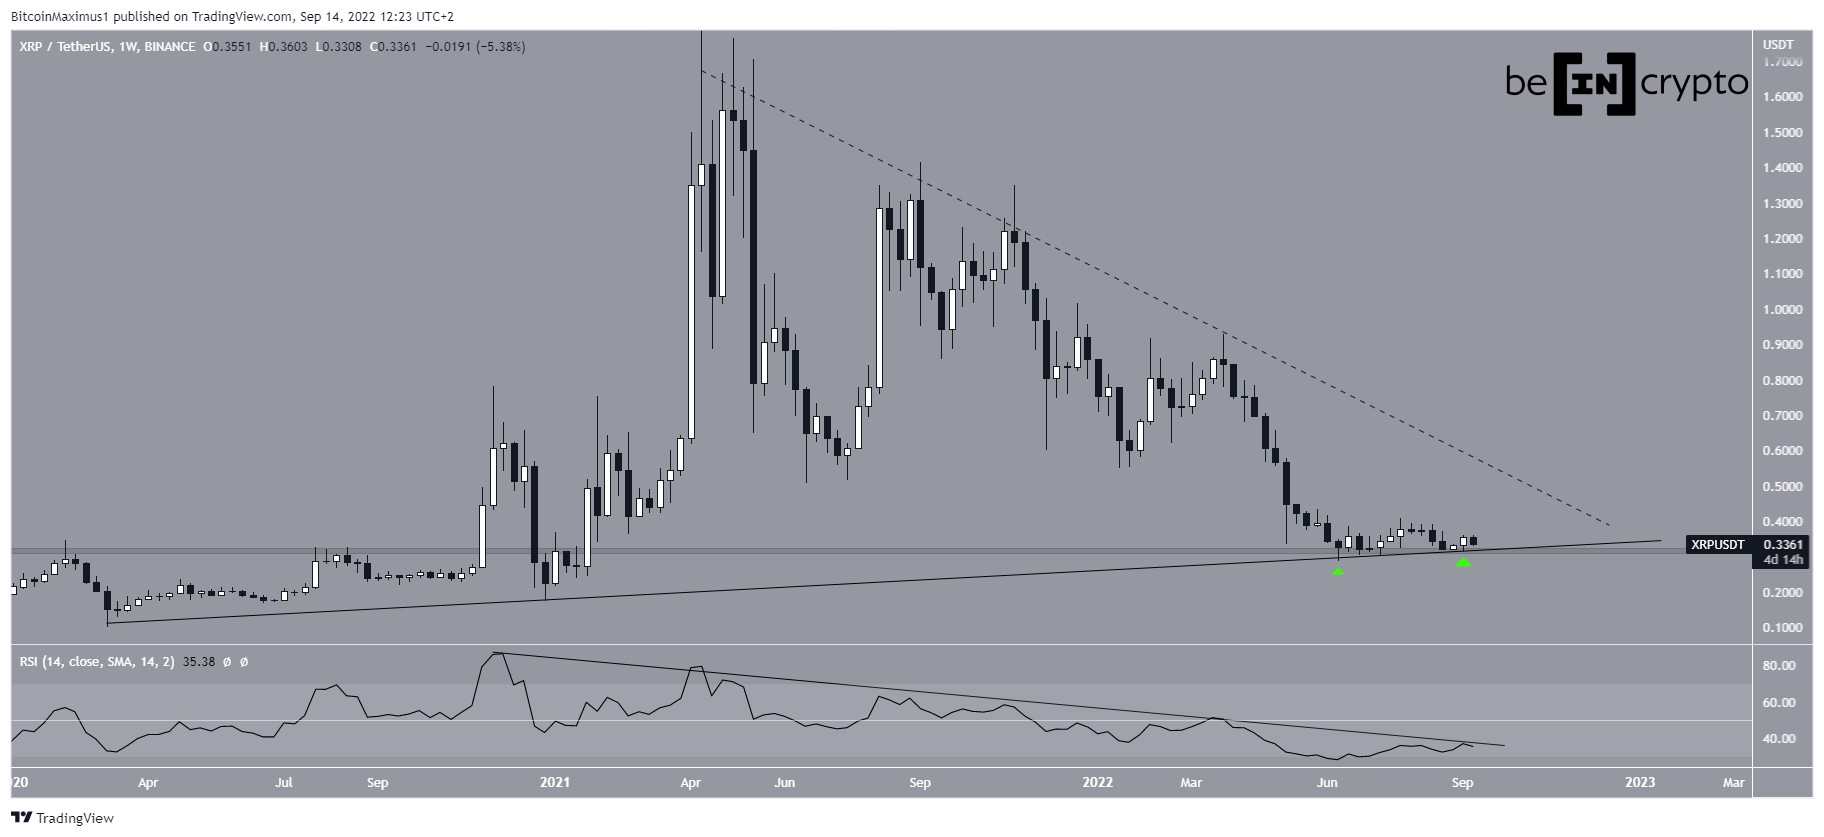
XRP Finally BouncesXRP has been decreasing rapidly since Dec. 22, when it initially broke down from the $0.475 resistance area. It continued its descent the next day and eventually reached a low of $0.173 on Dec. 29.
However, it has been gradually moving upwards since and began a significant bounce on Jan. 7. So far, the price has increased by 40% on the day. The increase was preceded by considerable bullish divergence in the RSI and an increase in the MACD.
Currently, XRP is trading right at the 0.382 Fib retracement of the entire downward movement at $0.358. The next resistance areas are at $0.416 and $0.475, respectively, the latter being both the previous breakdown area and the 0.618 Fib retracement level.
Therefore, if XRP gets there, it’s likely to face significant resistance.
Chart By TradingViewCryptocurrency trader @altcoinsherpa outlined an XRP chart, stating that despite being at resistance, the coin could continue running a little more towards $0.45.
While it could rally towards this level, it’s likely to face significant resistance at $0.47, which was the breakdown level that initiated the drop as outlined previously.
Therefore, until it reclaims this level, it’s still possible that the trend is bearish, and this is a retracement. Furthermore, the long-term count outlined in the previous article has XRP eventually falling below $0.10
Source: Twitter Short-Term MovementThe shorter-term six-hour chart shows signs of weakness, in the form of a significant hidden bearish divergence in the RSI.
Since hidden divergences are often determinants of the direction of the trend, it’s possible that today’s bounce is just a retracement and that the trend is still bearish.
Chart By TradingViewThe two-hour chart shows that the short-term movement has become parabolic. Also, XRP is following an ascending support line, which coincides with the minor $0.25 support area.
If it were to lose this area, it would confirm the bearish trend.
XRP Chart By TradingView ConclusionTo conclude, despite the significant rally that took place on Jan. 7, XRP has not yet confirmed a bullish trend.
Until the price successfully reclaims the breakdown level at $0.475, these increases may be retracements in response to the prior downward movement.
For BeInCrypto’s latest Bitcoin (BTC) analysis, click here!
Disclaimer: Cryptocurrency trading carries a high level of risk and may not be suitable for all investors. The views expressed in this article do not reflect those of BeInCrypto.
The post Is XRP Bullish Again After 40% Daily Rally? appeared first on BeInCrypto.
origin »Bitcoin price in Telegram @btc_price_every_hour
Ripple (XRP) на Currencies.ru
|
|
