2020-3-13 17:12 |
Beginning on March 7, with a high of $9,241, the BTC price began a rapid downward move. The rally stalled on March 9-11, but initiated the sharpest drop to date the next day, briefly reaching a low of $3,850.
Bitcoin (BTC) Price Highlights The Bitcoin price appears to be trading in either a descending or symmetrical triangle. It is following a shorter-term descending resistance line. The daily RSI is oversold.Well-known trader @PostyXBT outlined a massive descending triangle for BTC, with a resistance line drawn from the all-time high of December 2017 and a support line drawn at $3,300, touching the December 2018 bottom.
$BTC
Zooming out and thinking: how many people on CT would have told you that this scenario is *impossible* one week ago…
When fundamentals are having such a heavy impact on price action, you can't solely rely on support levels. pic.twitter.com/k8rVRaK3HN
— Posty (@PostyXBT) March 13, 2020
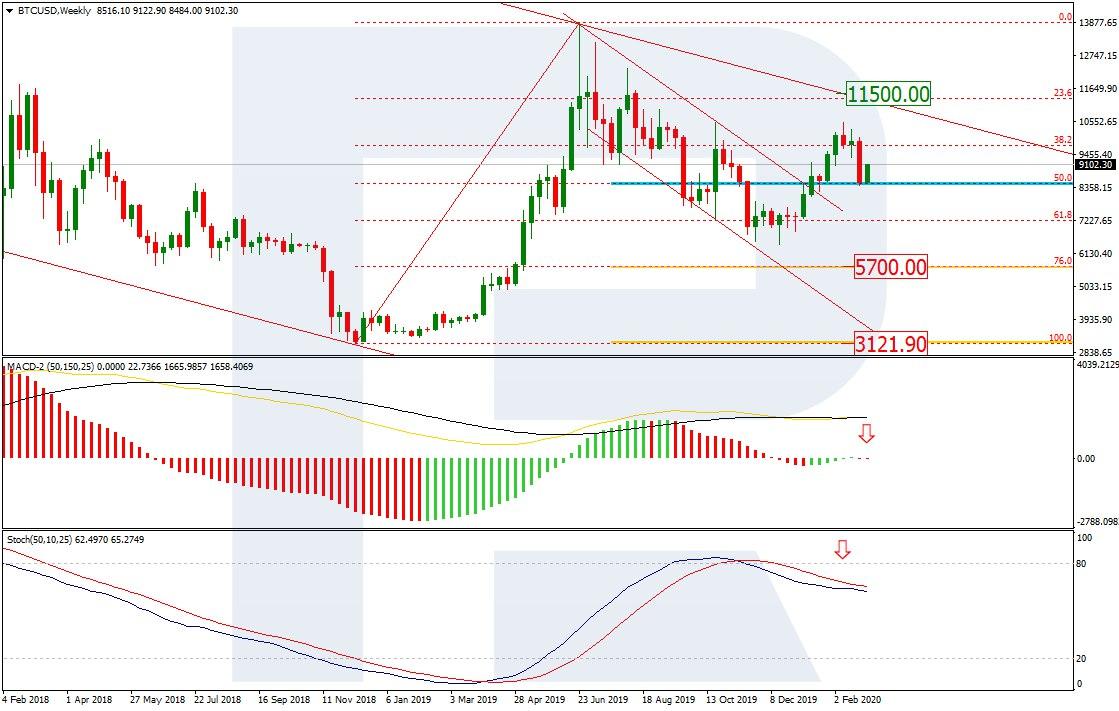
Bitcoin Triangle CharacteristicsIf the price is trading inside a descending triangle, it has been doing so since September 2017, when it reached a low of $2,980 and measures 910 days. The support line is drawn at $3,300, touching the December 2018 bottom. However, the line has only been validated twice, placing some doubt in its validity.
In addition, the descending triangle is a bearish pattern. A breakdown from the triangle that travels its entire height ($20,000 to $3,300) would take the price into negative territory, which is not possible. Therefore, a breakdown does not seem likely.
The resistance line is drawn from the December 2017 all-time high and has been validated thrice or four times, depending on how you draw its slope.
On the other hand, it is also possible that the price is trading inside a symmetrical triangle. The support line is drawn since July 2017 and has been touched four times including the most recent decrease, making it more possible that this is the support the price is following.
Since the symmetrical triangle is considered a neutral pattern, both a breakout and a breakdown remain equally likely. The triangle has been in place for 973 days.
These characteristics suggest that it is more likely that the price is trading inside a symmetrical rather than a descending triangle.
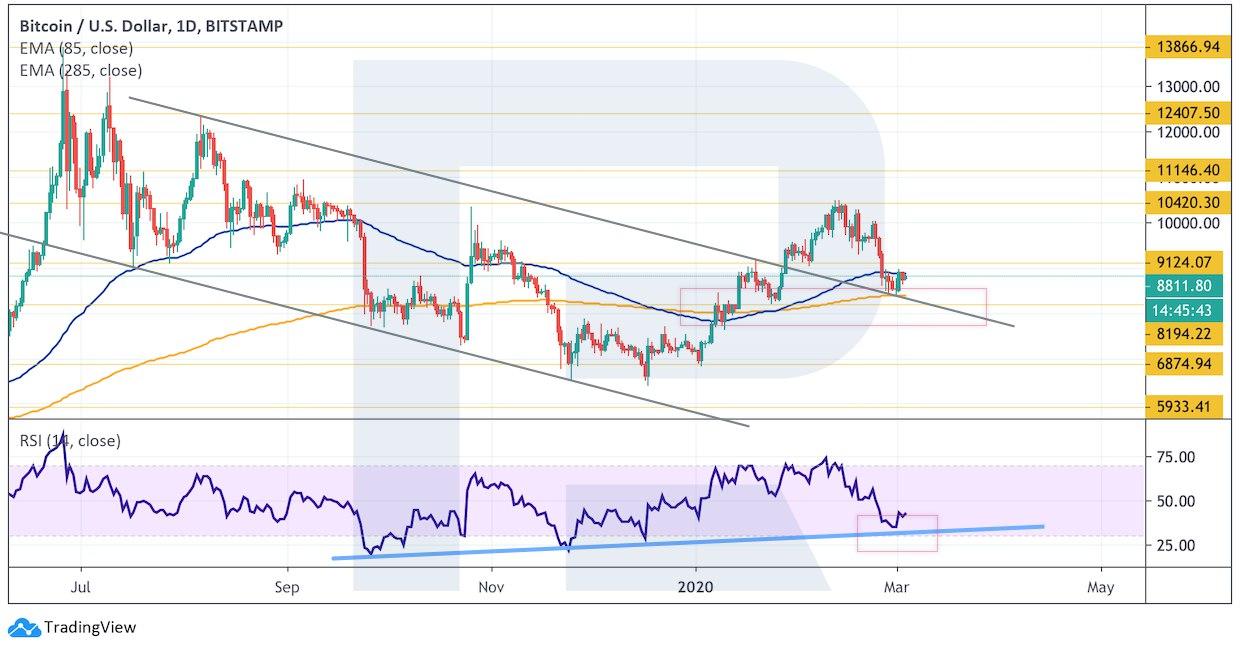
Descending Support LineThe daily chart shows a possible descending support line that the price has been following since July 16, 2019. The price has decreased well below this line but has failed to reach a close below it, rather creating a possible bullish harami candlestick.
In addition, the daily RSI is oversold and at the lowest levels it has seen since the December 2018 bottom.
To conclude, the BTC price has been decreasing rapidly over this week. It seems to be trading inside a symmetrical triangle, having possibly bounced in its support line.
The post Is the Bitcoin Price Following a Particular Pattern Anymore? appeared first on BeInCrypto.
origin »Bitcoin price in Telegram @btc_price_every_hour
Dropil (DROP) на Currencies.ru
|
|