2020-4-1 16:28 |
Since taking a significant move to the downside on March 12, the Bitcoin price has been trading in a range between $4,800-$6,800. The price reached the resistance line on March 25 and has been decreasing since.
Well-known trader @Mesawine1 outlined two Bitcoin charts. The first is drafted in a medium-term time-frame, showing a trading range for BTC, while the other focused on the shorter-term movement and shows a trading pattern instead. He stated that he believes that the price will break out from the current trading range, but expressed some doubt due to the tendency of Bitcoin to do the opposite of what seems most obvious.
$btc update:
pic1 well defined ranges on #bitcoin. Basically I'm looking for a break either side for my next trade.
pic2 most obvious #elliottwave count would be wxy with a triangle X.
However, #btc has a tendency not to do the obvious#crypto pic.twitter.com/MyRU4ruTg3
— Cryptotoad (@Mesawine1) April 1, 2020
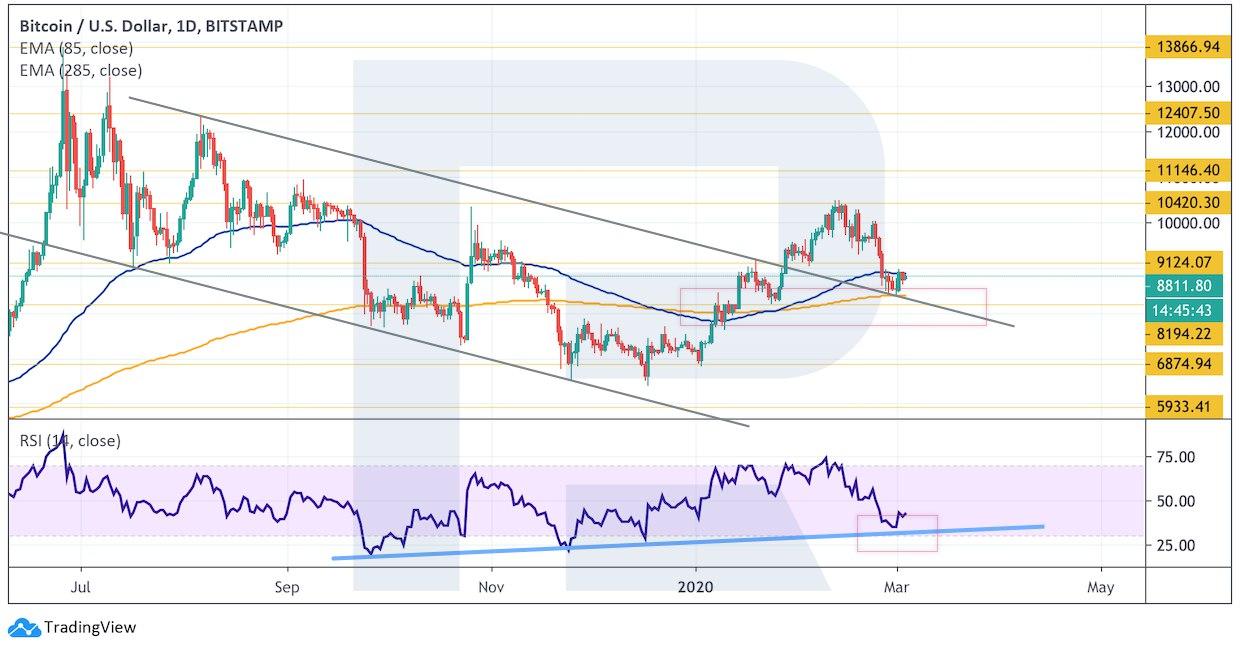
Trading RangeThe trading range is outlined using the closing prices from the daily time-frame. The important levels are as follows:
Resistance: $6,800 EQ: $5,800 Support: $4,800At the time of publishing, the BTC price was trading in the upper portion of the range after bouncing at the EQ on March 30. However, unlike the previous bounce on March 23, which took the price all the way to the resistance level, the current movement has been weaker, and the price has been decreasing since being rejected at $6,500.
It is possible that the price has created a head-and-shoulders pattern (H&S), and is currently in the process of finishing the right shoulder. Volume has been decreasing since creating the left shoulder, as is common in H&S patterns. If the pattern is confirmed, the EQ will act as the neckline and the breakdown could take the price all the way to the range low.
Bitcoin Chart By Trading View Symmetrical TriangleThe other possibility is that the price is trading inside a symmetrical triangle. Out of the two, this is the more bullish scenario.
The price has been correcting inside this pattern following an A-B-C-D-E wave count, as is common inside triangles. At the time of publishing, the price was trying to hold on to the $6,250 support area.
The movement once the price gets to the bottom of the E wave will be crucial in determining if the price movement is bullish or bearish. If the E wave makes a higher-low relative to waves A and C, it could mean that the price is following the ascending support line, and will be far more likely to bounce and break out from the triangle.
On the other hand, a breakdown from the support line and a revisit to the $5,800 support area would confirm the head-and-shoulders pattern.
Bitcoin Chart By Trading ViewTo conclude, the BTC price has been decreasing since reaching the range high on March 25. The price is in the process of either creating a head-and-shoulders or a symmetrical triangle pattern. The price movement once the price gets to $6,000 will be crucial in determining which pattern will be more likely to transpire.
The post Determining if Bitcoin’s Current Pattern is Bullish or Bearish appeared first on BeInCrypto.
origin »Bitcoin price in Telegram @btc_price_every_hour
Bitcoin (BTC) на Currencies.ru
|
|