Новости о Weekly Price [ Фото новости ] [ Свежие новости ] | |

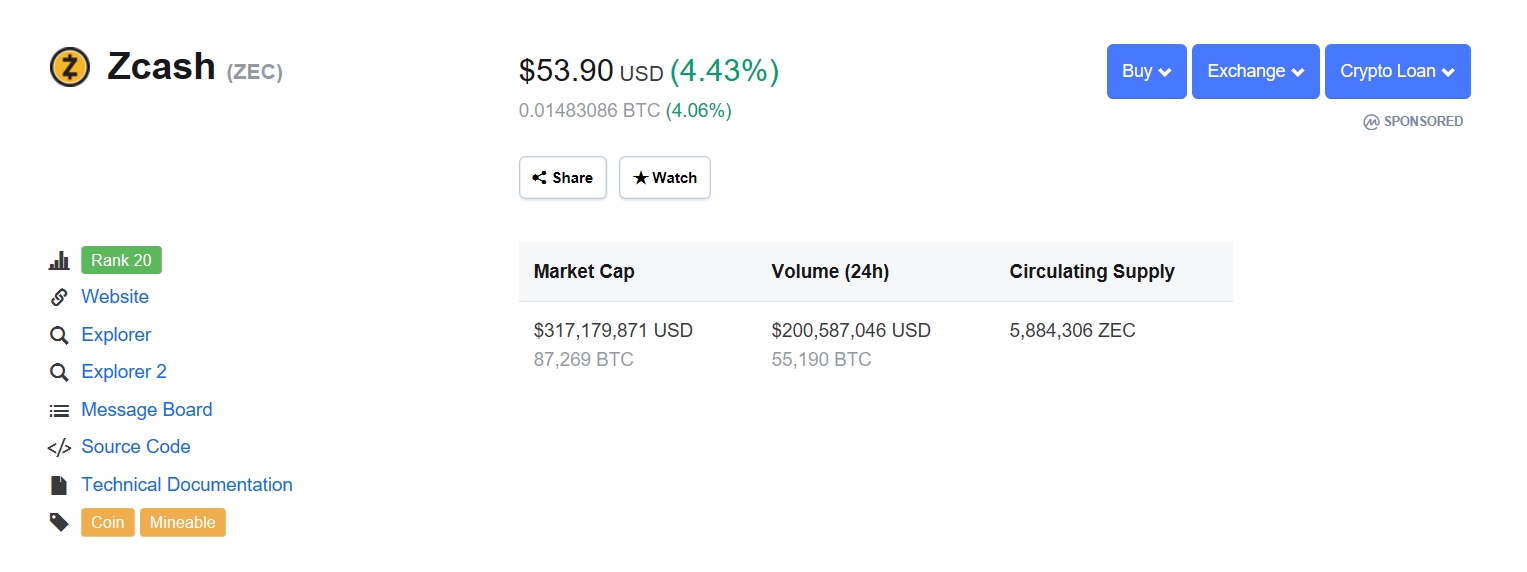
Zcash [ZEC] Price 4.5% Gain: Latest news to Stay Updated
Per time of writing the 20th largest coin by market capitalization Zcash is counting 4. 45% gain for the last 24-hours against the US Dollar. Source: coinmarketcap Breaking above the weekly declining trend acted as a catalyst for traders to step in and take the most out of the opportunity however the $55. дальше »
2019-2-13 14:18 | |
|
|
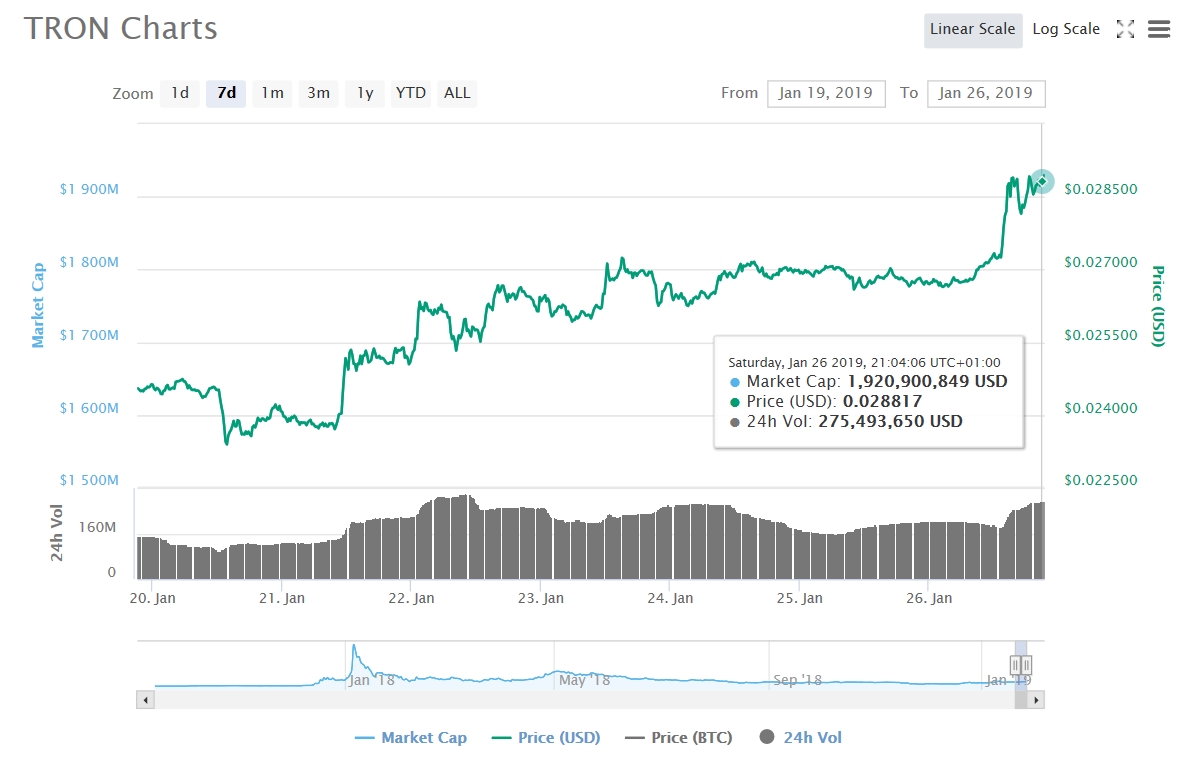
TRON Price Prediction: TRX / USD Has Broken Down From a Short Term Triangle Pattern, Where Is the Coin Heading Next?
Long-Term Outlook A look at the weekly chart for TRX shows that the price is currently trading at $0. 024 after retracing from the major resistance area near $0. 03. Price is trading above the 21-period MA but below the 50-period MA, which is offering resistance to price. дальше »
2019-2-13 14:14 | |
|
|
XRP Price Prediction: A Triple Bottom or a Cup and Handle Pattern?
Long-Term Outlook A look at the Weekly chart for XRP shows that the price is trading at $0. 3, right above the long-term support area at $0. 26-$0. 29. If the support area fails, the next one will be found near $0. дальше »
2019-2-12 14:48 | |
|
|

Bitcoin Price Analysis: $4000 in Sight After Last Week’s Bullish Move
As Bitcoin price finished the week with a strong move to the upside, we take a look at what this means for the Bulls and Bears heading into the week. Weekly Chart Bitcoin price closed the week at $3,650 (+6. дальше »
2019-2-11 17:00 | |
|
|

DASH Price Prediction: Price Breaks Out Above Resistance, Next Resistance at the 100-Day MA?
Long-Term Outlook A look at the Dash Weekly chart in logarithmic form shows that price briefly traded inside the support area at $45-$55, before starting an upward move and is now trading at $80. дальше »
2019-2-11 16:24 | |
|
|
Stellar Price Prediction: XLM Broke Out of the Descending Wedge, Is a Double Bottom in Store?
Long-Term Outlook A look at the Weekly chart for XLM in logarithmic form shows that price is currently trading at $0. 077, slightly above the main support area formed by the highs of 2017 near $0. дальше »
2019-2-10 18:59 | |
|
|
TRON Price Prediction: Did TRX Just Break Down From the Support Line of the Triangle?
Long-Term Outlook A look at the Weekly chart for TRX shows that price is trading at $0. 026, slightly below the main resistance area near $0. 03. The current weekly candle is an inverted hammer, which when found in an uptrend usually signifies a reversal. дальше »
2019-2-10 17:00 | |
|
|
Ripple Price Weekly Analysis: XRP Primed For More Upsides
Ripple price bounced back sharply and broke the $0. 3000 resistance level against the US dollar. There was a break above a major bearish trend line with resistance near $0. 2900 on the 4-hours chart of the XRP/USD pair (data source from Kraken). дальше »
2019-2-10 09:00 | |
|
|
Bitcoin Price Weekly Analysis: BTC Could Rebound To $4,000
Bitcoin price formed a significant support near the $3,345 level and jumped sharply against the US Dollar. There was a break above a crucial bearish trend line with resistance at $3,380 on the 4-hours chart of the BTC/USD pair (data feed from Kraken). дальше »
2019-2-10 08:08 | |
|
|
Ethereum Price Weekly Analysis: ETH Skyrockets, Dips Remain Supported
ETH price formed a solid support at $100 and started a strong uptrend against the US Dollar. There was a break above a crucial bearish trend line with resistance at $104 on the 4-hours chart of ETH/USD (data feed via Kraken). дальше »
2019-2-10 07:28 | |
|
|
Bitcoin Weekly Price Analysis: BTC/USD Recovery Spark in Store as Crypto Market Starts to Heat Up
General Market Overview Market Cap: $121,807,021,428 • 24h Vol: $24,759,467,157 • BTC Dominance: 52.9% From Monday when the evaluation of the cryptocurrency market cap has been around $113,5 billion and has mostly hovered around those levels until Wednesday when it fell to the horizontal support at around $111,5 billion. As the evaluation interacted with the […] дальше »
2019-2-9 21:45 | |
|
|

XRP Price Prediction: We Broke Out of the Descending Wedge, Where Is Price Heading to Next?
Long-Term Outlook A look at the Weekly chart for XRP shows that price is at the edge of the $0. 26-$0. 28 support area. If the support area fails to hold, the next one will be found near $0. 15. дальше »
2019-2-9 19:44 | |
|
|
Litecoin Price Prediction: LTC Initiated a Strong Upward Move, Can We Predict the Top?
Long-Term Outlook A look at the Weekly chart for Litecoin shows that price is currently forming a bullish engulfing weekly candle. Price is currently trading at $44 after briefly touching the resistance near $50 and retracing. дальше »
2019-2-9 17:09 | |
|
|
Stellar [XLM] Price Prediction: Does the Low Volume Indicate That This Was a False Breakout?
Long-Term Outlook A look at the Weekly chart for Stellar in logarithmic form shows that price is trading at $0. 077, slightly below the 200-Period MA and very close to the major support area formed by the highs of April 2017 at $0. дальше »
2019-2-8 14:59 | |
|
|
Tron [TRX] Price Prediction: Approaching the End of the Symmetrical Triangle, When Will the Breakdown Occur?
Long-Term Outlook A look at the Weekly chart shows that TRX has been following a descending support line since February 2019. Price was rejected for the third time in the resistance area of $0. 028-$0. дальше »
2019-2-7 16:09 | |
|
|
XRP Price Prediction: Are We Making a Triple Bottom, or Is a Breakout From the Descending Wedge Imminent?
Long-Term Outlook A look at the Weekly chart for XRP in logarithmic form shows that price is trading at $0. 293, within the upper bound of the support area of $0. 26-$0. 30. If the support area fails, the next one will be found at $0. дальше »
2019-2-6 14:49 | |
|
|
Binance Coin [BNB] Price Prediction: Does the Bearish Divergence Mean That We Just Made a Double Top?
Long-Term Outlook A look at the Weekly chart for BNB in logarithmic form shows that price is trading at $7, very close to the 7-period MA and the previous resistance area at $7. 5-$8. 5. The nearest support area can be found at $4. дальше »
2019-2-5 14:39 | |
|
|
Why the Bitcoin Price Will Reject the Bulls and Crash Even Lower
While financial forecasters are predicting a bullish 2019 for the bitcoin price, the cryptocurrency first needs to fight strong technical barriers in the near-term. It is becoming difficult for bitcoin bulls to initiate a substantial push towards the $3,480-barrier and beyond. дальше »
2019-2-5 00:50 | |
|
|

Ethereum Price Prediction: Did We Reach the Bottom or Is There Another Drop in Store?
Long-Term Outlook: A look at the Weekly chart for Ethereum in logarithmic form shows that after breaking down through the $180 support, the price is trading at $109, below the 7,21,50 period moving averages and the Ichimoku cloud. дальше »
2019-2-3 16:44 | |
|
|
DOGE, XRP, XLM, TRX: What’s in Store for Price in the Coming Weeks?
XRP Price Analysis: A look at the Weekly chart for XRP shows that price is very close to the $0. 26-$0. 28 support area, currently trading at $0. 30. Price is trading below the 7, 21, 50, 200-period moving averages and the Ichimoku cloud. дальше »
2019-2-3 16:19 | |
|
|
Bitcoin Price Weekly Analysis: BTC Rebound Approaching Crucial Resistance
Bitcoin price formed a support base near $3,370 and recovered higher above $3,450 against the US Dollar. There was a break above a major contracting triangle with resistance at $3,440 on the 4-hours chart of the BTC/USD pair (data feed from Kraken). дальше »
2019-2-3 08:00 | |
|
|
Ethereum Price Weekly Analysis: ETH Facing Uphill Task Near $114
ETH price recovered a few points, but it is facing a lot of hurdles near $114 against the US Dollar. There was a break above a major bearish trend line with resistance at $107 on the 4-hours chart of ETH/USD (data feed via Kraken). дальше »
2019-2-3 07:08 | |
|
|
Litecoin [LTC] Price Prediction: Will the Third Attempt Be Successful at Breaking Through Resistance?
Long-Term Outlook A look at the Weekly chart for Litecoin in logarithmic form shows that price has fallen all the way to the support area formed by the highs of 2014 at $25-$30. Price is currently trading at $33. дальше »
2019-2-2 20:09 | |
|
|
Ripple’s XRP Price Action – XRP Outperforms Top Cryptocurrencies as Doji Candle forms on Weekly
XRP has outperformed the majority of other top cryptocurrencies over the past week. Data from Messari show price depreciating just 3% over the past seven days, outperformed only by litecoin which is recording only a 0. дальше »
2019-2-2 18:54 | |
|
|
Bitcoin Price Action – Is BTC Setting up for Another Significant Bearish Move?
There are warning signs on the weekly chart that Bitcoin could potentially be set up for another significant bearish move. Many analysts are monitoring the 200 simple moving average (SMA) which is often used to identify the direction of the long-term trend. дальше »
2019-2-2 18:19 | |
|
|
(+) Weekly Recap: Crypto Winter Continues as NEM Foundation Crumbles, Bitcoin Falls 7.6% in January
Crypto winter shows no signs of abating anytime soon. In the past week, bitcoin rounded out its sixth consecutive month in the red while the NEM Foundation suspended all projects and partnerships due to the sinking XEM price. дальше »
2019-2-2 21:38 | |
|
|
Ripple’s XRP Price Action – XRP Forms a Bullish Hammer Candle
Cryptocurrencies started the week with bearish movements but underwent a brief recovery on Wednesday. Most have since started to trade lower and are recording a loss for the week. XRP has recovered to a greater extent than other top cryptocurrencies such as Bitcoin and Ethereum. дальше »
2019-2-1 19:24 | |
|
|
Ripple (XRP) in Pump-and-Dump Scenario, Sinks 12% from Weekly High
A substantial Ripple rally fizzled as the asset’s value fell as much as 12% from its weekly high. The XRP-to-USD exchange rate (XRP/USD) dropped to an intraday low at 0. 3003 this Friday. Earlier yesterday, the pair had established a new weekly high at 0. дальше »
2019-2-2 14:11 | |
|
|
Tron Price Prediction: The Second Attempt at Breaking Resistance Was Unsuccessful, Will Price Break Through on the Third One?
Long-Term Outlook A look at the Weekly chart for Tron shows that price is following a descending support line. Price is currently trading at $0. 026, slightly below the resistance area of $0. 028-$0. дальше »
2019-2-1 14:04 | |
|
|
Dogecoin: Price Is Still Trading in a Downward Channel, When Will Doge Break Out?
Long-Term Outlook A look at the Weekly chart for Dogecoin shows that price is currently trading at $0. 00187, at the bottom of the support area of $0. 0018-$0. 002. If the support area falls, the next one will be found at $0. дальше »
2019-2-1 12:54 | |
|
|
Stellar [XLM] Price Prediction: Approaching the Support Area, When Will the Bull Run Start?
Long-Term Outlook A look at the Weekly chart for XLM in logarithmic form shows that price is trading at $0. 084, very close to the support area at $0. 06-$0. 07. Price is trading below the 7,21,50 period moving averages and the Ichimoku Cloud. дальше »
2019-1-31 17:14 | |
|
|
XRP Price Prediction: Was This the Breakout of the Descending Wedge?
Long-Term Outlook A look at the Weekly chart for XRP in logarithmic form shows that price is very close to the $0. 26-$0. 30 support area, currently trading at $0. 31. Price is trading below the 7,21 period moving averages and the Ichimoku Cloud. дальше »
2019-1-31 15:19 | |
|
|
IOTA Price Prediction: Finally Arriving at the Breakout of the Wedge
Long-Term Outlook A look at the Weekly chart for IOTA in logarithmic form shows that price touched the resistance area at $0. 18-$0. 22 and immediately started an upward move to the next resistance area at $0. дальше »
2019-1-30 18:04 | |
|
|
Litecoin [LTC] Price Prediction: Will the Third Attempt at Breaking Resistance Be Successful?
Long-Term Outlook A look at the Weekly chart for Litecoin in logarithmic form shows that the price is very close to the support area of $25-$30 formed by the highs of 2014, currently trading at $32. дальше »
2019-1-30 17:24 | |
|
|
XRP Price Prediction: The Symmetrical Triangle Is Invalidated, Is a Double Bottom in Store?
Long-Term Outlook A look at the Weekly chart for XRP shows that price is trading within the $0. 27-$0. 30 area of support, currently trading at $0. 294. If the support fails, the next area of support will be found at $0. дальше »
2019-1-29 17:34 | |
|
|
Dogecoin Price Prediction: Doge Is at the Bottom of the Support Range, Will It Continue Its Fall or Move Upward?
Long-Term Outlook A look at the Weekly chart for Dogecoin in logarithmic form shows that price is currently trading at $0. 0019 at the bottom/slightly below the support area. Price is trading below the 7,21,50 period moving averages and the Ichimoku cloud. дальше »
2019-1-29 14:34 | |
|
|

Bitcoin Price Analysis: Major Support Broken on Expanding Volume and Spread
After weeks of consolidation, bitcoin finally broke through support. The market now finds itself cruising toward prior lows. On expanding volume and spread, the bitcoin market appears ripe for a continuation of the downtrend:Figure 1: BTC-USD, Daily Candles, Broken SupportAlthough the current daily candle has yet to close, unless there is a strong influx of demand hitting the market, it stands to reason that bitcoin will be closing a new daily low for the first time since mid-December. дальше »
2019-1-29 02:01 | |
|
|
Stellar (XLM) Price Prediction: The Rally After the Wedge Breakout Failed, Are We Heading Lower?
Long-Term Outlook A look at the Weekly chart for XLM in logarithmic form shows that price has fallen all the way to the 200-period moving average and is currently trading at $0. 088. Furthermore, the price is trading below the 7, 21, 50 period MAs and the Ichimoku Cloud. дальше »
2019-1-28 17:54 | |
|
|
Bitcoin Price Weekly Analysis: BTC Trading Near Make-or-Break Levels
Bitcoin price is trading nicely above the $3,500 support area against the US Dollar. There is a major ascending channel formed with resistance at $3,650 on the 4-hours chart of the BTC/USD pair (data feed from Kraken). дальше »
2019-1-27 09:00 | |
|
|
Ethereum Price Weekly Analysis: ETH’s Next Crucial Break Is Near
ETH price remained below the $120 and $125 resistance levels against the US Dollar. There is a crucial bearish trend line formed with resistance at $116 on the 4-hours chart of ETH/USD (data feed via Kraken). дальше »
2019-1-27 08:00 | |
|
|
TRON (TRX) Defies The Price Trend: Latest News to Be Updated
Founded by Justin Sun – a well respected and popular leader among many individuals in the crypto-verse, Tron is a project within only a few which are known for keeping their promises and post success in a weekly basis when it comes to development and advancement. дальше »
2019-1-27 00:25 | |
|
|
TRON Price Prediction: How Long Will TRX Continue the Rally?
Long-Term Outlook A look at the Weekly chart for TRX shows that price is following a descending support line. After bouncing in December, the price has moved past the 7-period moving average and is now headed for the $0. дальше »
2019-1-26 20:49 | |
|
|
Price Predictions for the Top 5 Penny Cryptocurrencies: XRP, XLM, TRX, ADA & IOTA
XRP Price Prediction and Analysis: A look at the Weekly chart for XRP shows that price is very close to the major support area at $0. 30. Price is trading below the 7 and 21 period moving averages. дальше »
2019-1-26 17:09 | |
|
|

Litecoin [LTC] Price Prediction: Did We Reach a Bottom at $25?
Long-Term Outlook A look at the Weekly chart for Litecoin in logarithmic form shows that after falling to the major support area at $23-$26, the price promptly reversed with an upward move towards the 200-period Moving Average. дальше »
2019-1-25 15:14 | |
|
|
Top 10 Cryptocurrencies: Price Predictions for 2019
Bitcoin [BTC] price analysis and prediction: A look at the Weekly chart for Bitcoin in logarithmic form shows that price is trading at $3600. Several similarities are noticeable between the 2014 “crash” and the 2018 one. дальше »
2019-1-25 20:29 | |
|
|
Bitcoin price prediction: Possible descending wedge breakout
Long-term outlook: A look at the Weekly chart for Bitcoin shows that price is currently trading at $3640, finding steady support at the 200-period moving average. The RSI was below 30 for a short while, indicating oversold conditions. дальше »
2019-1-24 17:29 | |
|
|
Dogecoin Price Prediction: DOGE Is at the Lower Range of the Support Area, When Will It Start a Rally?
Long-Term Outlook A look at the Weekly chart for Dogecoin shows that price has fallen to the long-standing support area at $0. 002, which coincides with the 200-period moving average. Furthermore, the MACD is starting to turn and is getting ready to make a bullish cross. дальше »
2019-1-23 17:14 | |
|
|