Новости о Weekly Chart [ Фото новости ] [ Свежие новости ] | |

Tron Price Prediction: The Second Attempt at Breaking Resistance Was Unsuccessful, Will Price Break Through on the Third One?
Long-Term Outlook A look at the Weekly chart for Tron shows that price is following a descending support line. Price is currently trading at $0. 026, slightly below the resistance area of $0. 028-$0. дальше »
2019-2-1 14:04 | |
|
|
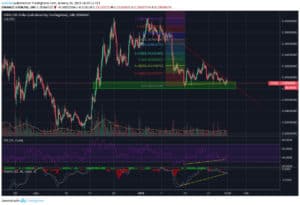
Dogecoin: Price Is Still Trading in a Downward Channel, When Will Doge Break Out?
Long-Term Outlook A look at the Weekly chart for Dogecoin shows that price is currently trading at $0. 00187, at the bottom of the support area of $0. 0018-$0. 002. If the support area falls, the next one will be found at $0. дальше »
2019-2-1 12:54 | |
|
|
Stellar [XLM] Price Prediction: Approaching the Support Area, When Will the Bull Run Start?
Long-Term Outlook A look at the Weekly chart for XLM in logarithmic form shows that price is trading at $0. 084, very close to the support area at $0. 06-$0. 07. Price is trading below the 7,21,50 period moving averages and the Ichimoku Cloud. дальше »
2019-1-31 17:14 | |
|
|
XRP Price Prediction: Was This the Breakout of the Descending Wedge?
Long-Term Outlook A look at the Weekly chart for XRP in logarithmic form shows that price is very close to the $0. 26-$0. 30 support area, currently trading at $0. 31. Price is trading below the 7,21 period moving averages and the Ichimoku Cloud. дальше »
2019-1-31 15:19 | |
|
|
IOTA Price Prediction: Finally Arriving at the Breakout of the Wedge
Long-Term Outlook A look at the Weekly chart for IOTA in logarithmic form shows that price touched the resistance area at $0. 18-$0. 22 and immediately started an upward move to the next resistance area at $0. дальше »
2019-1-30 18:04 | |
|
|
Litecoin [LTC] Price Prediction: Will the Third Attempt at Breaking Resistance Be Successful?
Long-Term Outlook A look at the Weekly chart for Litecoin in logarithmic form shows that the price is very close to the support area of $25-$30 formed by the highs of 2014, currently trading at $32. дальше »
2019-1-30 17:24 | |
|
|
XRP Price Prediction: The Symmetrical Triangle Is Invalidated, Is a Double Bottom in Store?
Long-Term Outlook A look at the Weekly chart for XRP shows that price is trading within the $0. 27-$0. 30 area of support, currently trading at $0. 294. If the support fails, the next area of support will be found at $0. дальше »
2019-1-29 17:34 | |
|
|
Dogecoin Price Prediction: Doge Is at the Bottom of the Support Range, Will It Continue Its Fall or Move Upward?
Long-Term Outlook A look at the Weekly chart for Dogecoin in logarithmic form shows that price is currently trading at $0. 0019 at the bottom/slightly below the support area. Price is trading below the 7,21,50 period moving averages and the Ichimoku cloud. дальше »
2019-1-29 14:34 | |
|
|
Stellar (XLM) Price Prediction: The Rally After the Wedge Breakout Failed, Are We Heading Lower?
Long-Term Outlook A look at the Weekly chart for XLM in logarithmic form shows that price has fallen all the way to the 200-period moving average and is currently trading at $0. 088. Furthermore, the price is trading below the 7, 21, 50 period MAs and the Ichimoku Cloud. дальше »
2019-1-28 17:54 | |
|
|
Bitcoin Price Weekly Analysis: BTC Trading Near Make-or-Break Levels
Bitcoin price is trading nicely above the $3,500 support area against the US Dollar. There is a major ascending channel formed with resistance at $3,650 on the 4-hours chart of the BTC/USD pair (data feed from Kraken). дальше »
2019-1-27 09:00 | |
|
|
Ethereum Price Weekly Analysis: ETH’s Next Crucial Break Is Near
ETH price remained below the $120 and $125 resistance levels against the US Dollar. There is a crucial bearish trend line formed with resistance at $116 on the 4-hours chart of ETH/USD (data feed via Kraken). дальше »
2019-1-27 08:00 | |
|
|
TRON Price Prediction: How Long Will TRX Continue the Rally?
Long-Term Outlook A look at the Weekly chart for TRX shows that price is following a descending support line. After bouncing in December, the price has moved past the 7-period moving average and is now headed for the $0. дальше »
2019-1-26 20:49 | |
|
|
Price Predictions for the Top 5 Penny Cryptocurrencies: XRP, XLM, TRX, ADA & IOTA
XRP Price Prediction and Analysis: A look at the Weekly chart for XRP shows that price is very close to the major support area at $0. 30. Price is trading below the 7 and 21 period moving averages. дальше »
2019-1-26 17:09 | |
|
|

Litecoin [LTC] Price Prediction: Did We Reach a Bottom at $25?
Long-Term Outlook A look at the Weekly chart for Litecoin in logarithmic form shows that after falling to the major support area at $23-$26, the price promptly reversed with an upward move towards the 200-period Moving Average. дальше »
2019-1-25 15:14 | |
|
|
Top 10 Cryptocurrencies: Price Predictions for 2019
Bitcoin [BTC] price analysis and prediction: A look at the Weekly chart for Bitcoin in logarithmic form shows that price is trading at $3600. Several similarities are noticeable between the 2014 “crash” and the 2018 one. дальше »
2019-1-25 20:29 | |
|
|
Bitcoin price prediction: Possible descending wedge breakout
Long-term outlook: A look at the Weekly chart for Bitcoin shows that price is currently trading at $3640, finding steady support at the 200-period moving average. The RSI was below 30 for a short while, indicating oversold conditions. дальше »
2019-1-24 17:29 | |
|
|
Dogecoin Price Prediction: DOGE Is at the Lower Range of the Support Area, When Will It Start a Rally?
Long-Term Outlook A look at the Weekly chart for Dogecoin shows that price has fallen to the long-standing support area at $0. 002, which coincides with the 200-period moving average. Furthermore, the MACD is starting to turn and is getting ready to make a bullish cross. дальше »
2019-1-23 17:14 | |
|
|
Ripple Price Analysis: XRP Buyers Target Fresh Weekly Highs
Ripple price tested the $0. 3050 support level and later bounced back above $0. 3120 against the US dollar. There was a break above a major bearish trend line with resistance at $0. 3160 on the hourly chart of the XRP/USD pair (data source from Kraken). дальше »
2019-1-23 08:00 | |
|
|
XRP Price Prediction: Approaching the End of the Symmetrical Triangle
Long-Term Outlook A look at the Weekly chart for XRP shows that price is currently trading at $0. 32, close to the long-standing support area at $0. 3. Price is facing very close resistance from the 7-period moving average and is also below the Ichimoku cloud. дальше »
2019-1-22 15:04 | |
|
|
Bitcoin Price Weekly Analysis: BTC Could Accelerate Gains Above $3,850
Bitcoin price formed a solid support near the $3,560 level and moved higher against the US Dollar. There is a crucial bearish trend line in place with resistance near $3,850 on the 4-hours chart of the BTC/USD pair (data feed from Kraken). дальше »
2019-1-20 09:00 | |
|
|
Ethereum Price Weekly Analysis: ETH Facing Uphill Task Near $128
ETH price faced a strong resistance near the $127 and $128 levels recently against the US Dollar. There is a major bearish trend line formed with resistance at $125 on the 4-hours chart of ETH/USD (data feed via Kraken). дальше »
2019-1-20 07:08 | |
|
|
IOTA Price Prediction: Are We Done Retracing or Is Another Drop in Store?
Long-Term Outlook A look at the Weekly chart for IOTA in logarithmic form shows that price fell to the main resistance area at $0. 21-0. 23. Afterward, price started a small rally until the first resistance area at $0. дальше »
2019-1-18 14:19 | |
|
|
Stellar [XLM] Price Prediction: Price Broke Out of the Descending Wedge, What Is Next?
Long-Term Outlook A look at the Weekly chart for Stellar in logarithmic form shows that price broke the long-standing support line at $0. 2 in mid-November and is now close to the first major support area in $0. дальше »
2019-1-17 20:27 | |
|
|
Ripple Price Analysis: XRP Could Target Fresh Weekly Lows
Ripple price is struggling to gain momentum above the $0. 3300 and $0. 3320 resistances against the US dollar. There is a key bullish trend line formed with support at $0. 3240 on the hourly chart of the XRP/USD pair (data source from Kraken). дальше »
2019-1-17 08:00 | |
|
|

Dogecoin [DOGE] Price Prediction: After a Month of Retracing, Is a Rally in Store?
A look at the Weekly chart for Dogecoin shows that price fell right back to the 0. 002$ support area formed by previous lows. Furthermore, the price is very close to the 200-period moving average which is also offering support. дальше »
2019-1-16 17:24 | |
|
|
Ripple Price Analysis: XRP at Potentially Key Turning Point
Ripple price traded to a new weekly high at $0. 3384 and later corrected lower against the US dollar. There was a break below a key bullish trend line with support at $0. 3250 on the hourly chart of the XRP/USD pair (data source from Kraken). дальше »
2019-1-16 08:00 | |
|
|

XRP Price Prediction: After Breaking Down From a Short-term Triangle, Where Will XRP Go Next?
Long-Term Outlook A look at the Weekly XRP chart shows that price hit support at the $0. 3 area quickly rallied upward to $0. 4. Price made a spinning top candle which indicates indecision in the market and followed that with a bearish engulfing candle. дальше »
2019-1-15 16:39 | |
|
|
Ripple Price Analysis: XRP Targets Fresh Weekly Highs Above $0.3500
Ripple price found support above the $0. 3100 level and recovered above $0. 3300 against the US dollar. There was a break above a major bearish trend line with resistance at $0. 3200 on the hourly chart of the XRP/USD pair (data source from Kraken). дальше »
2019-1-15 08:00 | |
|
|
Tron [TRX] Price Prediction & Analysis: Price Is Close to Support, Does It Have Strength for Another Rally?
Long-Term Outlook A look at the Weekly chart for TRX shows that price is following a descending support line and currently trading at $0. 023. Price rallied until $0. 04 where it found resistance corresponding with the 21 period moving average and promptly reversed. дальше »
2019-1-14 16:19 | |
|
|
Bitcoin Price Weekly Analysis: BTC’s Bullish and Bearish Scenarios Analyzed
Bitcoin price declined recently and traded below the $3,725 support against the US Dollar. There is a short term breakout pattern forming with resistance near $3,650 on the 4-hours chart of the BTC/USD pair (data feed from Kraken). дальше »
2019-1-13 09:00 | |
|
|
Ethereum Price Weekly Analysis: ETH Could Accelerate Losses Below $121
ETH price declined heavily this past week below the $146 and $130 supports against the US Dollar. There is a crucial bearish trend line formed with resistance at $138 on the 4-hours chart of ETH/USD (data feed via Kraken). дальше »
2019-1-13 08:18 | |
|
|

Bitcoin Price Analysis: Curb Your Enthusiasm!
Bulls made a surprising move but the follow through was less than satisfactory. Will Bitcoin price sustain above $4,000? Bitcoin Price: Market Overview At last, the bulls made a strong move but it is not as convincing as it could be. дальше »
2019-1-8 12:00 | |
|
|
Bitcoin Price Weekly Analysis: BTC Approaching Significant Break
Key Points Bitcoin price failed to gain momentum above $3,900 and declined recently against the US Dollar. There is a major contracting triangle formed with support at $3,765 on the 4-hours chart of the BTC/USD pair (data feed from Kraken). дальше »
2019-1-6 08:00 | |
|
|
Ethereum Price Weekly Analysis: ETH Could Surge Toward $180
Key Highlights ETH price remained in a solid uptrend and it could trade above $170 and $180 against the US Dollar. There is a crucial bullish trend line formed with support at $148 on the 4-hours chart of ETH/USD (data feed via Kraken). дальше »
2019-1-6 07:08 | |
|
|

XRP Price Prediction – Movement Within a Symmetrical Triangle
A look at the Weekly chart in logarithmic form for XRP shows that price fell to the support area of $0. 25-0. 30 and a bounce ensued. Price found resistance at $0. 42 and formed a spinning top candle (yellow arrow) indicating indecision. дальше »
2019-1-5 20:32 | |
|
|
Ethereum Classic (ETC) Long Term Price Forecast- January 5
ETC/USD Long-term Trend: Bearish. Resistance levels: $8, $10, $ 12Support levels: $5, $3, $1. On December 17, the ETC/USD pair had been in a bullish trend. From the weekly chart, the bulls are making a bullish movement to the 12-day EMA and the 26-day EMA. If the bulls break above the EMAs, the crypto will […] дальше »
2019-1-5 08:50 | |
|
|
Bitcoin Price Weekly Analysis: BTC Holding Key Uptrend Support
Key Points Bitcoin price declined recently towards the $3,560 support area against the US Dollar. There is a key bullish trend line formed with support $3,680 on the 4-hours chart of the BTC/USD pair (data feed from Kraken). дальше »
2018-12-30 08:00 | |
|
|
Ethereum Price Weekly Analysis: ETH Facing Strong Resistance Near $140
Key Highlights ETH price started a major upward move after forming a low at $112. 80 against the US Dollar. There was a break above a major bearish trend line with resistance at $122 on the 4-hours chart of ETH/USD (data feed via Kraken). дальше »
2018-12-30 07:08 | |
|
|
TRON [TRX]: After the Rally, How Long Will the Short-term Retracement Last?
A look at the Weekly chart for Tron (TRX) shows that price has been following a falling support line. The RSI is 40, indicating neither overbought nor oversold conditions. The MACD recently made a bullish cross (yellow arrow) and is seemingly headed upward. дальше »
2018-12-28 14:49 | |
|
|
Ripple’s XRP: Is the Rally Genuine or Are We Falling Below Support?
A look at the Weekly chart in logarithmic form for Ripple’s XRP shows that price retouched support at $0. 25-$0. 30 once more, and similarly to the last time a short rally ensued. However, in comparison to the one in early September, the rally was shorter and with lower volume. дальше »
2018-12-27 17:49 | |
|
|
Dogecoin [DOGE]: Price Hit Support for the Third Time, What Now?
A look at the Weekly chart for Dogecoin in logarithmic form shows that price fell to the main support area at $0. 002 for the third time. If this area does not hold, the next support area will be at $0. дальше »
2018-12-27 17:39 | |
|
|
Ethereum [ETH]: Price Rebounded Right Back to Triple Digits, What Is Next?
A look at the Weekly chart for Ethereum in logarithmic form shows that price fell to the first mini-support area at $80 then quickly rallied to meet resistance at $160-$180. The candle for the week of 16-22 December is the largest bullish candle of the year and is accompanied by large volume as well (yellow […] Ethereum [ETH]: Price Rebounded Right Back to Triple Digits, What Is Next? was originally found on [blokt] - Blockchain, Bitcoin & Cryptocurrency News. дальше »
2018-12-27 14:49 | |
|
|
NEO: Is a Rally Coming, or Is Price Going to Continue the Fall?
A look at the Weekly chart for NEO shows that price fell from the long-standing support area of $18-22 and is now trading at around $7. Price dropped all the way to $5, coming close to the bottom achieved in late October 2017 at $3. дальше »
2018-12-27 13:19 | |
|
|
Litecoin: Is This a Correction or the Beginning of a New Rally?
A look at the Weekly Litecoin chart in logarithmic form shows that price fell to the $20-25 support area formed by the 2014 high. Afterwards, the price began a rally, and it is now trading at $30. дальше »
2018-12-27 12:34 | |
|
|
Bitcoin Price Weekly Analysis: BTC Primed To Test $5,000
Key Points Bitcoin price gained pace recently and broke the $3,580 and $3,780 resistances against the US Dollar. There is a major symmetrical triangle forming with resistance at $4,080 on the 4-hours chart of the BTC/USD pair (data feed from Kraken). дальше »
2018-12-23 08:00 | |
|
|
Ethereum Price Weekly Analysis: ETH Breaks $125, Could Test $140
Key Highlights ETH price surged higher and broke the $115 and $125 resistance levels against the US Dollar. There is a major bullish trend line formed with support at $114 on the 4-hours chart of ETH/USD (data feed via Kraken). дальше »
2018-12-23 07:08 | |
|
|
IOTA: After Hitting a Bottom, IOTA’s Price Rallies 60%
A look at the Weekly chart for IOTA in logarithmic form shows that price broke the $0. 4 level of support and fell to $0. 2, a drop of 95% from the January high, forming a bottom in early December. дальше »
2018-12-21 17:29 | |
|
|
Ethereum Classic [ETC]: Has It Finally Reached the Bottom?
Long-Term Outlook A look at the Weekly chart for Ethereum Classic (ETC) shows that price broke the longstanding support at the $10 level and now has fallen to $4, slightly above the next support area at $3. дальше »
2018-12-20 17:29 | |
|
|

TRON [TRX] – Price Breaks Through Short-term Resistance, What’s Next?
A look at the weekly chart for TRX shows that price has fallen 95% in value since the January high of $0. 34 and is now trading at around $0. 015. Price is moving in a descending support line, depicted by the solid green line. дальше »
2018-12-19 16:24 | |
|
|
Cardano (ADA): Price Is Back to Opening Levels, What Will Happen Next?
A look at the weekly chart for ADA shows that price has lost 98% of its value since the January 2018 high and is now trading close to the $0. 03 level. It is worth noting that there was significant buyer volume in the third week of September as evidenced by the higher green bar. дальше »
2018-12-18 17:24 | |
|
|