Новости о Weekly Chart [ Фото новости ] [ Свежие новости ] | |

OMG Network (OMG) Approaches Long-Term Resistance at $6.50
Due to OMG Network reclaiming the minor resistance area and the bullishness from technical indicators, it’s likely that the breakout will be successful. OMG Network Long-Term Levels The weekly chart shows that OMG is trading just below the long-term $6. дальше »
2021-2-10 16:30 | |
|
|
XRP Continues Range Trading in Uncertain Trend
The direction of the trend for XRP is uncertain, but it will most likely complete one more leg down before an eventual upward move. XRP Range Trading The weekly chart shows that XRP has been twice rejected by the long-term $0. дальше »
2021-2-3 20:09 | |
|
|
0x (ZRX) Bounces Back but Fails to Clear Resistance
While an eventual breakout is likely, 0x is expected to decrease in the short-term once more before bouncing higher. 0x Long-Term Levels The weekly chart shows that despite a significant upward move, ZRX has been decreasing since being rejected by the 0. дальше »
2021-1-27 13:28 | |
|
|
After Rejection, ADA Readies for Breakout Attempt
Despite the rejection, ADA has reclaimed the previous breakout level and should resume its upward movement towards $0. 45. Long-Term Levels The weekly chart shows that ADA is trading right at the long-term $0. дальше »
2021-1-26 21:54 | |
|
|
Dogecoin Price Analysis - DOGE/USD shows bullish Cloud metrics
The weekly DOGE/USD chart shows bullish Cloud metrics for the first time since 2018. In the near term, another move above 33 sats should be seen as a leading bullish momentum indicator. дальше »
2021-1-21 14:01 | |
|
|
VeChain (VET) Rebounds After Correction from All-Time High
While a short-term rejection could occur, VeChain is expected to eventually resume its upward movement toward new all-time highs. VeChain Scores New All-Time High The weekly chart shows that VET has finally moved above the $0. дальше »
2021-1-19 18:48 | |
|
|
Ethereum Gets Stopped Just Short of an All-Time High
While Ethereum seems to be correcting in the short-term, it is expected to eventually initiate another upward move and reach a new all-time high. Ethereum Denied New High The weekly chart shows that ETH nearly reached a new all-time high on Jan. дальше »
2021-1-14 01:06 | |
|
|
LTC Moves Above $150, Reaching Highest Price Since 2018
While it could continue increasing and reach the $185 resistance area, it appears the current rally is top-heavy, and a corrective movement will soon follow. LTC’s Long-Term Movement The weekly chart shows that LTC has finally moved above the June 2019 highs at $145 and has actually reached a weekly close above this level. дальше »
2021-1-5 22:54 | |
|
|
Bitcoin Cash (BCH) Approaches Massive Descending Resistance
While a short-term decrease could occur, Bitcoin Cash is expected to eventually be successful in breaking out above this resistance line. Long-Term Bitcoin Cash Resistance The weekly chart shows that BCH has moved above the previous resistance area at $318, created by the 0. дальше »
2020-12-30 12:34 | |
|
|
XRP Loses Long-Term Support after Significant Drop
Until XRP reclaims this level, the long-term trend is considered bearish. Long-Term XRP Levels The weekly chart shows that XRP has decreased to reach a close below the $0. 32 area. This is a level that had been acting as support since it initially broke out in November. дальше »
2020-12-29 16:10 | |
|
|
Long-Term Resistance Rejects BTCD, Relief Alt Rally Ahead
A short-term BTCD decline towards the support levels at 61 – 64% is likely, paving the way for an alt relief rally. BTCD Reaches Resistance The weekly chart shows that BTCD has broken out from a descending resistance line that had previously been in place since Aug. дальше »
2020-12-28 16:53 | |
|
|
Ethereum Rally Puts $800 Level in View
The Ethereum trend has not shown any weakness yet, suggesting that the $835 area will be reached. Long-Term Ethereum Levels The weekly chart for ETH shows that the price is approaching the long-term $835 resistance level (0. дальше »
2020-12-28 15:03 | |
|
|
Will BNB Reach a New All-Time High Price?
Long-term support The weekly chart shows that BNB has been following an ascending support line since reaching a low of $6. 38 in March. It has been consistently increasing above this support line, but has just begun to show its first signs of weakness. дальше »
2020-12-24 20:43 | |
|
|
DOGE Breaks Out and Targets $0.0055
DOGE should continue increasing and break out from the resistance area outlined in the article. Similarly, DOGE/BTC has reached a crucial long-term support area from which a bounce is likely. Breakout and Retest The weekly chart shows that DOGE has been moving upwards since March. дальше »
2020-12-23 16:46 | |
|
|
Monero (XMR) Falls Back but Holds on Above Crucial Support
However, the decrease only served to validate the breakout level and Monero is expected to move upwards once more. Monero Long-Term Movement The weekly chart shows that XMR is trading between major support and resistance levels of $133-$166, created by the 0. дальше »
2020-12-23 14:30 | |
|
|
Litecoin (LTC) Finally Breaks Out Above Long-Term Resistance
Both the LTC/USD and LTC/BTC pairs should continue moving upwards towards the targets given below. Breakout From Long-Term Resistance The weekly chart shows that LTC has finally moved above the $85 resistance area, something it has struggled to do since July 2019. дальше »
2020-12-18 16:01 | |
|
|
BCH’s Attempted Breakout Could Lead to a Push Above $400
BCH should successfully break out and begin moving towards the resistance levels outlined in this article. Long-Term Resistance The weekly chart shows that the price has been moving upwards since March. дальше »
2020-12-18 17:48 | |
|
|
Blockstack (STX) Sets Sights on New All-Time High
Blockstack (STX) is expected to resume its upward movement towards the resistance targets which we will outline below. Blockstack (STX) Flips Resistance to Support The weekly chart for STX shows that while it has been increasing since March, it has struggled to break out above the $0. дальше »
2020-12-18 15:29 | |
|
|
Bitcoin Stumbles on Approach to Yet Another All-Time High
However, the price movement suggests that Bitcoin will soon make yet another attempt at breaking out, though a short-term correction could occur prior. Bitcoin All-Time High Resistance The weekly chart shows that BTC is trading very close to a long-term resistance area, created by the all-time highs near $19,600. дальше »
2020-12-15 12:29 | |
|
|
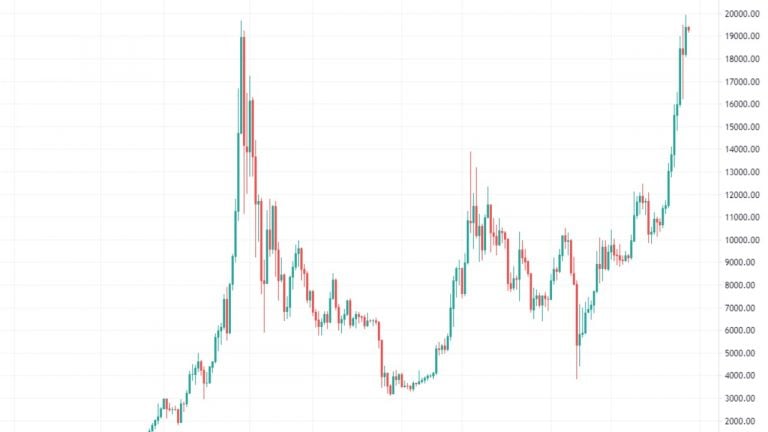
Market Watch by Fyookball: Price Is in a Tight Channel
BTC is often a good macro indicator for the entire crypto market, so this is a good place to start. Bitcoin (BTC) has recently surpassed its all-time high price just shy of $20,000, so it’s a unique time to zoom out and look at the weekly chart for the past several years. дальше »
2020-12-7 15:30 | |
|
|
BCH Struggles to Regain Footing After Considerable Decline
Long-Term Movement The weekly chart for BCH shows that the 0. 5 Fib retracement level rejected the price twice (shown with the red arrows below) at $316. While BCH has moved above this level, notably reaching a high of $363, it has failed to close above it, creating a long upper wick instead. дальше »
2020-12-1 18:34 | |
|
|
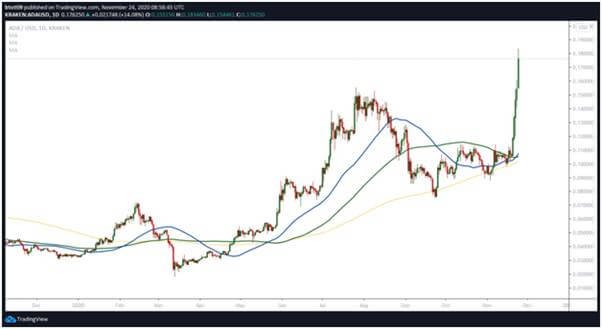
Charted: Ripple (XRP) Weekly Chart Suggests Massive Breakout To $0.75
Ripple surged over 40% and it even broke the $0. 4500 resistance against the US Dollar. XRP price weekly chart suggests high chances of more upsides towards $0. 6000 and $0. 7500. Ripple started a strong surge after it broke the $0. дальше »
2020-11-23 10:28 | |
|
|
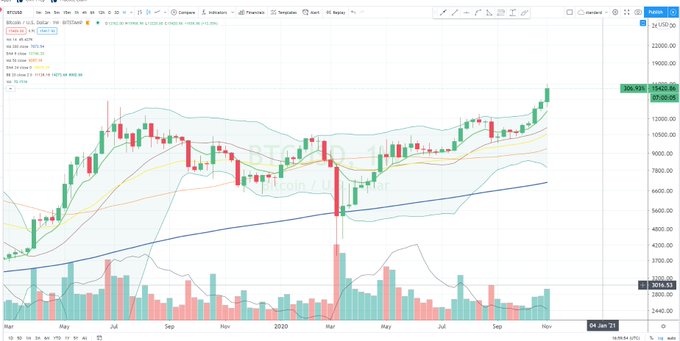
Despite Drop From $16k High, Bitcoin’s Weekly Chart Is “Convincing”
Bitcoin has dropped since the highs of $15,975 set in the middle of last week. The price of the leading cryptocurrency currently trades for $15,200 but traded as low as $14,300 on Saturday. Despite the drop, analysts believe that the cryptocurrency remains on an upward path. дальше »
2020-11-9 02:15 | |
|
|
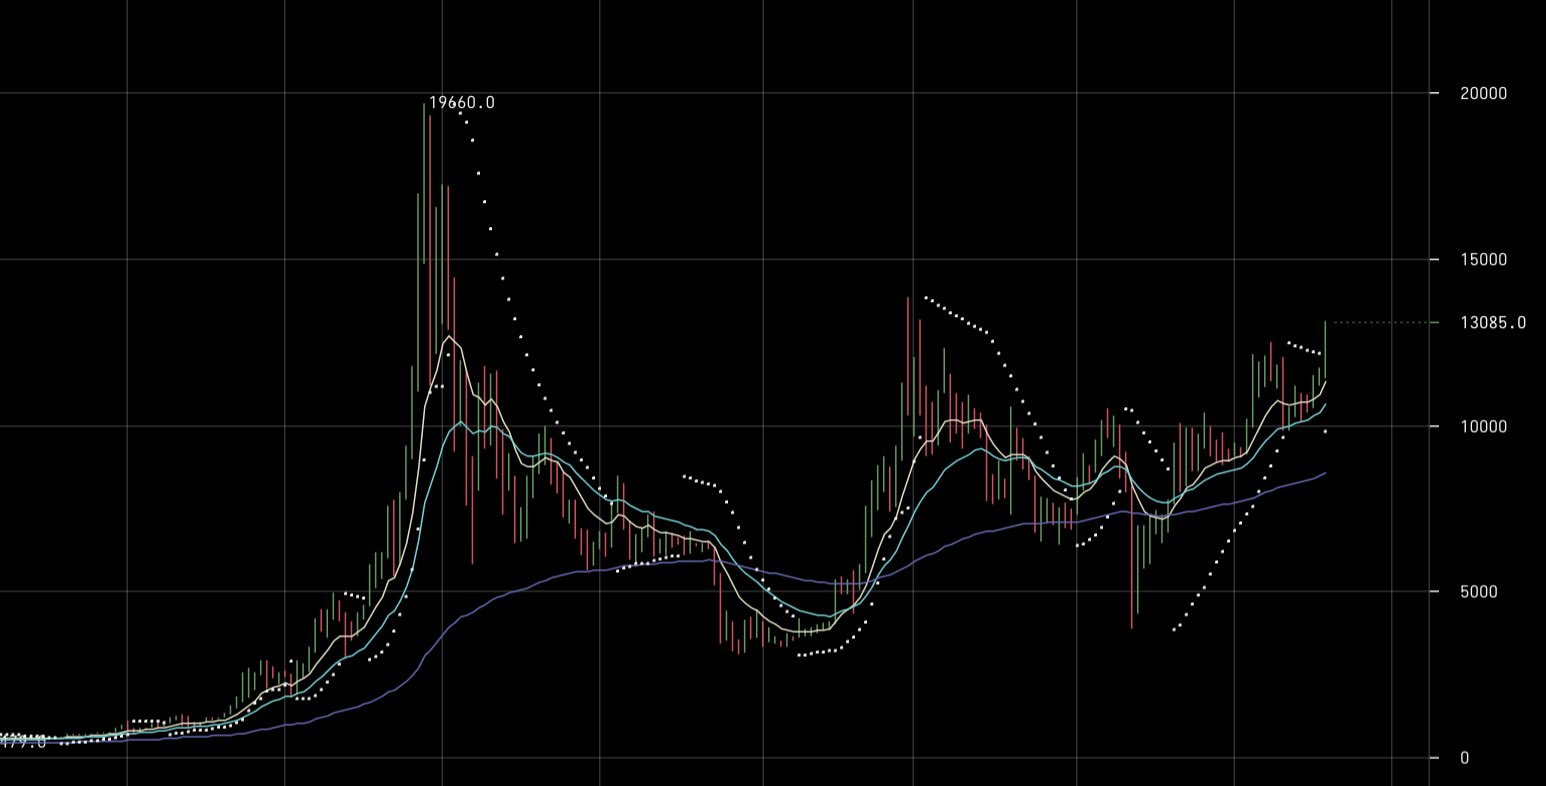
Bitcoin Reaches Highest Weekly Close in Nearly Three Years
During the week of Oct 19-26, Bitcoin (BTC) reached a close above $13,000. While the long-term trend is bullish, the short-term chart has begun to show weakness. Whether the price breaks out or down from the current parallel channel will likely determine the direction of the short-term movement. дальше »
2020-10-26 13:25 | |
|
|
Synthetix founder calls Bitcoin’s weekly chart the “most bullish thing” he has seen
Bitcoin’s price action over recent weeks and months has undoubtedly been bullish. The post Synthetix founder calls Bitcoin’s weekly chart the “most bullish thing” he has seen appeared first on CryptoSlate. дальше »
2020-10-25 14:25 | |
|
|


Is Bitcoin (BTC) a buy or sell in September?
Bitcoin (BTC) price is currently trading over 2% in the red on a weekly chart as technicals point to a continuation in the downtrend in the coming days and weeks. Fundamental analysis: Can Bitcoin stage a rally? Bitcoin price recorded some sharp price swings over the last week, keeping investors alert. дальше »
2020-9-9 13:33 | |
|
|
After Validating Support, ZEC Looks Primed for Continuation
The Zcash (ZEC) price has broken out from an important resistance area and validated it as support afterward. The price should continue moving upwards and create a new yearly high. Long-Term Movement The weekly chart shows that ZEC has broken out above the $77. дальше »
2020-9-2 22:18 | |
|
|
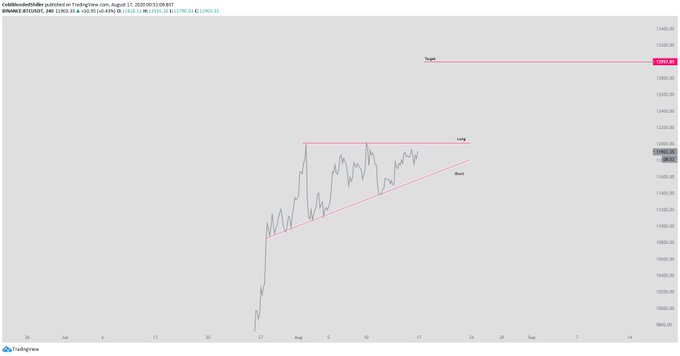
This Textbook Chart Pattern Predicts Bitcoin Will Hit $13,000 Imminently
Bitcoin has stalled despite posting a weekly close above the pivotal $11,800 level that analysts eyed. BTC remains in a textbook bullish chart pattern. That pattern is an ascending triangle, which has been a pattern of importance throughout Bitcoin’s history. дальше »
2020-8-18 13:00 | |
|
|
IOTA Signals Bull Run After Forming Its First Weekly Golden Cross
IOTA, a transaction settlement token for the Internet of Things (IoT), has surged by more than 400 percent from its March 2020 nadir. Its price rally this week led to the formation of its first Golden Cross on a weekly chart. дальше »
2020-7-31 16:04 | |
|
|

Will ADA Break Out Above 1500 Satoshis?
The Cardano (ADA) price has been increasing since March and doing so at an accelerated rate since June. The price is currently correcting, after which the upward move should resume. Long-Term ADA Movement The weekly chart for ADA shows a double bottom combined with significant bullish divergence on the weekly RSI from August 2019 – […] The post Will ADA Break Out Above 1500 Satoshis? appeared first on BeInCrypto. дальше »
2020-7-21 20:29 | |
|
|

Chainlink (LINK) Smashes Through Its All-Time High Price
On July 6, the Chainlink (LINK) price broke out from the $4. 9 resistance area that had been in place since July 2019. Since then, the price has increased by almost 70%. All-Time High A look at the weekly chart shows that LINK has been on an upward trend since its inception. дальше »
2020-7-14 01:30 | |
|
|

IOTA Signals A Long-Term Trend Reversal
The IOTA price has been consolidating near 2000 satoshis since August 2019. The price has been showing strong signs of a reversal, indicating that a bullish trend may soon begin. Weekly Analysis The weekly chart for IOTA reveals that the price has been decreasing since September 2018. дальше »
2020-6-18 23:15 | |
|
|

Is Bitcoin in a Long-Term Bullish Trend?
The Bitcoin (BTC) price has created a weekly bullish engulfing candlestick and moved above a long-term descending resistance line. Weekly Bitcoin Outlook In the weekly chart, the price of Bitcoin (BTC) followed a doji from the previous week by creating a bullish engulfing candlestick. дальше »
2020-5-19 11:36 | |
|
|

How Long Will Digibyte Continue to Pump?
On March 23, the Digibyte (DGB) price reached a low of 52 satoshis. It immediately began an upward move which is still ongoing. To date, the price has increased by 462% since. Using the weekly chart, we can see that the upward move was preceded by a very significant bullish divergence in the RSI, which […] The post How Long Will Digibyte Continue to Pump? appeared first on BeInCrypto. дальше »
2020-5-7 17:10 | |
|
|
Altcoins Face The Most Important Weekly Close in Crypto History
Two separate charts taking a top-down view across the wider crypto market may provide clues as to where the altcoin asset class is headed. Each chart shows that altcoins are at potentially their most critical moment yet, and are facing the most important weekly close yet at the end of this week. Altcoins Start 2020... дальше »
2020-5-1 20:30 | |
|
|

The Bitcoin Price Has Reclaimed an Important High Time-Frame Support
The Bitcoin price began a rapid decrease on March 19, at one point increasing by 22% from its low of $5,252. The price has continued its increase today, reaching a high of $6,900. Well-known trader @CryptoCred posted a Bitcoin chart stating that the price is trading inside a very significant weekly time-frame area, with support […] The post The Bitcoin Price Has Reclaimed an Important High Time-Frame Support appeared first on BeInCrypto. дальше »
2020-3-21 20:15 | |
|
|
Bitcoin miners could cry capitulation yet again with price eyeing $7,600 level
The past week was brutal for Bitcoin, with the weekly candle coming to a close today. The weekly chart looked bearish with the current weekly candle engulfing 3 candles before it. As the price hoveredThe post Bitcoin miners could cry capitulation yet again with price eyeing $7,600 level appeared first on AMBCrypto. дальше »
2020-3-1 17:00 | |
|
|

Ripple Bolstering Ultra Bullish Moves For XRP As Markets Face Tough Consolidation
XRP has been facing a tough consolidation period losing 36% of its gains over the last two weeks as bears are clearly taking over. A lot of analysts and traders are still quite bullish about XRP in the medium-term as the weekly chart is still favoring the bulls. дальше »
2020-2-28 11:52 | |
|
|

WTC Reverses Its Trend With Strong Breakout
On February 2, the WTC price broke out from a long-term descending resistance line and has been increasing since. WTC Highlights There is significant resistance at 12,000 satoshis. The weekly chart indicates that WTC has possibly reversed its trend. дальше »
2020-2-11 08:18 | |
|
|
Altcoin Market Bottoms With Highest Buy Volume in Crypto History
Last week the altcoin market exploded, bursting through local downtrend resistance and going on a rally that added over $30 billion in value to the overall crypto market cap sans Bitcoin. The breakout was accompanied by the highest level of buy volume on the total altcoin market cap weekly price chart, which could indicate that... The post appeared first on NewsBTC. дальше »
2020-1-21 22:00 | |
|
|
Bitcoin Signal That Preceded 288% Rally About to Flash, and It’s Huge for Bulls
While Bitcoin (BTC) has struggled, experiencing two plunges of 7% and 3%, respectively, the weekly chart of the cryptocurrency is on the verge of printing a bullish signal. The signal in question was last seen prior to BTC’s 288% surge from the mid-$3,000s to $14,000 in a few months’ time. дальше »
2020-1-20 14:00 | |
|
|