Новости о Trading Breakout [ Фото новости ] [ Свежие новости ] | |


Bitcoin Price Analysis: Consolidation Breaks Out Into Macro Resistance Test
Over the course of the last 10 days, bitcoin has managed to rally nearly 20% in value as it burst through two major resistance levels and is now beginning the test of a major macro level:Figure 1: BTC-USD, Daily Candles, Macro ResistanceWe can see a clear, descending supply-and-demand channel that governed the market for the last two months. дальше »
2019-2-20 01:38 | |
|
|
EOS Price Prediction: Price Is Possibly Moving in an Ascending Triangle, Is the Breakout Occurring?
Long-Term Outlook A look at the Weekly chart for EOS shows that price is trading inside the minor resistance area at $3. The price is trading below the 21,50 period MA and the Ichimoku Cloud. After the breakdown at $5, price bottomed near $2 and quickly launched an upward move. дальше »
2019-2-18 15:09 | |
|
|
XRP Price Stable Against Coinmotion Criticism
By Dmitriy Gurkovskiy, Chief Analyst at RoboForex On Feb 15, the XRP is moving up slightly, trading at $0. 3089. Over a few weeks, the crypto has been forming a triangle, still without testing either the resistance or the support. дальше »
2019-2-15 20:23 | |
|
|
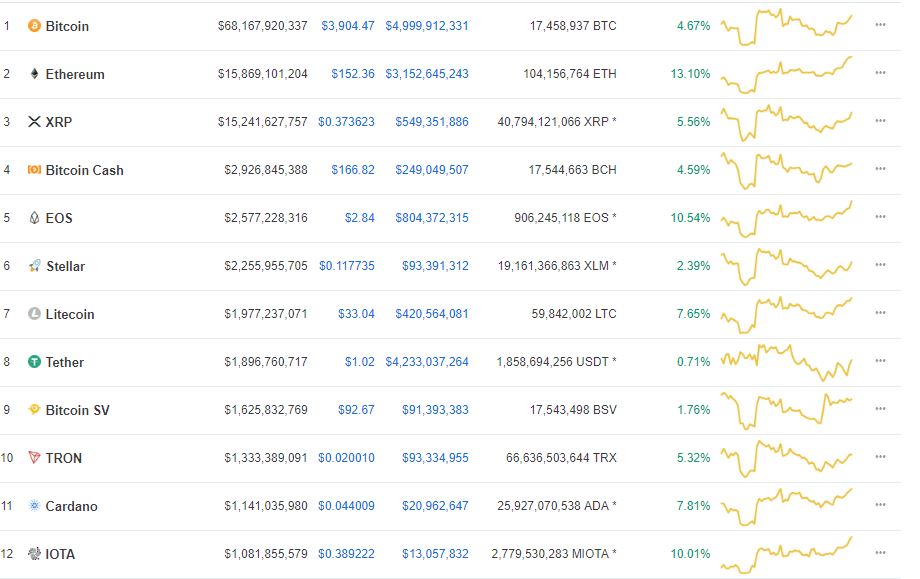
Binance Coin set to hit $10, Stellar (XLM) At Risk Of Being Overtaken By BNB
The Binance coin BNB has been outperforming in the cryptocurrency market since the past two weeks. As if moving from the 12th spot to the 10th spot in less than two weeks isn’t outstanding enough, BNB is taking things to another level with a trading price nearing a $10 breakout. дальше »
2019-2-11 15:35 | |
|
|
Bitcoin Bulls Stampede Past $3,700 & Wider Crypto Market Rallies with Them
Everyone knew a breakout was coming. A tight trading pattern lasted for weeks, which is almost always a precursor to big activity, one way or the other. In the case of Bitcoin and most everything else in the crypto market over the past 24-hours, things went very positive. дальше »
2019-2-9 03:08 | |
|
|
Stellar [XLM] Price Prediction: Does the Low Volume Indicate That This Was a False Breakout?
Long-Term Outlook A look at the Weekly chart for Stellar in logarithmic form shows that price is trading at $0. 077, slightly below the 200-Period MA and very close to the major support area formed by the highs of April 2017 at $0. дальше »
2019-2-8 14:59 | |
|
|
XRP Price Prediction: Are We Making a Triple Bottom, or Is a Breakout From the Descending Wedge Imminent?
Long-Term Outlook A look at the Weekly chart for XRP in logarithmic form shows that price is trading at $0. 293, within the upper bound of the support area of $0. 26-$0. 30. If the support area fails, the next one will be found at $0. дальше »
2019-2-6 14:49 | |
|
|
Binance Coin Bullishly Exploding, BNB Becomes the 10th Largest Cryptocurrency
Great times are surfacing for the Binance team as well as BNB traders as the coin has continued to gain more grounds with a massive increase in both volume, price and most importantly market capitalization. дальше »
2019-2-6 13:48 | |
|
|
XRP Price Prediction: Was This the Breakout of the Descending Wedge?
Long-Term Outlook A look at the Weekly chart for XRP in logarithmic form shows that price is very close to the $0. 26-$0. 30 support area, currently trading at $0. 31. Price is trading below the 7,21 period moving averages and the Ichimoku Cloud. дальше »
2019-1-31 15:19 | |
|
|
IOTA Price Prediction: Finally Arriving at the Breakout of the Wedge
Long-Term Outlook A look at the Weekly chart for IOTA in logarithmic form shows that price touched the resistance area at $0. 18-$0. 22 and immediately started an upward move to the next resistance area at $0. дальше »
2019-1-30 18:04 | |
|
|
Stellar (XLM) Price Prediction: The Rally After the Wedge Breakout Failed, Are We Heading Lower?
Long-Term Outlook A look at the Weekly chart for XLM in logarithmic form shows that price has fallen all the way to the 200-period moving average and is currently trading at $0. 088. Furthermore, the price is trading below the 7, 21, 50 period MAs and the Ichimoku Cloud. дальше »
2019-1-28 17:54 | |
|
|
Bitcoin Price Analysis: Strong Move Likely Following Tightly Coiled Market
Days and days of sideways consolidation and tightening volume has been the name of the game for the bitcoin market. A narrow range of $200 has caused a weeks worth of activity to coil and consolidate in preparation for bitcoin’s next move:Figure 1: BTC-USD, Daily Candles, Narrow RangeThe figure above shows just how narrow the range has been over the last week as the market has continued to grind out support and fail to break above overhanging resistance. дальше »
2019-1-26 03:13 | |
|
|
Bitcoin price prediction: Possible descending wedge breakout
Long-term outlook: A look at the Weekly chart for Bitcoin shows that price is currently trading at $3640, finding steady support at the 200-period moving average. The RSI was below 30 for a short while, indicating oversold conditions. дальше »
2019-1-24 17:29 | |
|
|
Bitcoin Price Analysis: Bitcoin Tests Boundary Support as Demand Weakens
Following last Friday’s drop, bitcoin has found itself coiled, once again, at the bottom of the range it established back in December. With the current market unable to close a new high, the market finds itself in a precarious position:Figure 1: BTC-USD, Daily Candles, Range Support TestThe blue support level shown above illustrates the boundary of the multi-week range bitcoin has been bound by. дальше »
2019-1-18 02:02 | |
|
|
Cryptocurrency Market sets out in a Bullish pattern, positions BCH, ETH and EOS for a price breakout
The cryptocurrency market has taken a rather impressive turn since the last 24hrs when most tokens and coins were only making a little above 2% to 4% in gains, but as usual, the unpredictable structure of the market has moved to a more trading friendly position as more and more tokens continue to attain gains. дальше »
2019-1-15 22:45 | |
|
|
Tron Price Analysis: TRX Surge, can it Flip Ethereum to Second?
Tron price is up 39. 5 percent from last Tuesday Platform is attracting gamers thanks to Tron Arcade Transaction volumes are fair and trading within a bullish breakout pattern. No doubt, Tron (TRX) is one of the best performers in the last week. дальше »
2019-1-8 19:00 | |
|
|
Bitcoin Cash (BCH) Near Make-or-Break Levels
Bitcoin cash price started a downside correction after trading above $235 against the US Dollar. BCH/USD traded below $200 and it is currently consolidating near $150. Key Talking Points Bitcoin cash price declined recently and broke the $200 and $175 supports against the US Dollar. дальше »
2019-1-8 08:22 | |
|
|
Bitcoin Price Analysis: Range-Bound Market Coiled for Next Move
For the better part of a month and a half, bitcoin has been fairly range-bound and unable to establish new lows or new highs. There are some bullish and bearish setups on the horizon for bitcoin, so let’s check out both sides of the argument because currently the market is sitting in the middle of Indecisionville — the most immediate sign of which is this glaringly obvious head-and-shoulders bottom reversal pattern:Figure 1: BTC-USD, Daily Candles, Head-and-Shoulders BottomThis current pattern is nothing more than a setup at the moment, but it represents one potential outcome of this sustained consolidation. дальше »
2019-1-4 02:22 | |
|
|
The January Effect and New Capital: Why Bitcoin (BTC) and other Cryptos Are in the Green
Many crypto enthusiast and traders were aware that there might be massive volatility as we headed into the Holiday Season of 2018. Many had expected a Santa Claus rally or a false breakout as many traders were cashing out to spend time with family. дальше »
2019-1-2 21:27 | |
|
|
Bitcoin Price Watch: BTC Signaling Breakout Above $4,500
Key Points Bitcoin price traded higher and broke the $4,150 and $4,200 resistance levels against the US Dollar. There was a break above a major bearish trend line with resistance at $4,040 on the hourly chart of the BTC/USD pair (data feed from Kraken). дальше »
2018-12-24 10:00 | |
|
|
Litecoin (LTC) Daily Price Forecast – December 18
LTC/USD Medium-term Trend: Bullish Resistance Levels: $66, $68, $70 Support Levels: $22, $20, $18 Yesterday, December 17, the price of Litecoin was in a bullish trend. The price of Litecoin was trading in the bearish trend zone before the outcome of the bullish breakout. дальше »
2018-12-18 10:10 | |
|
|
Ethereum (ETH) Daily Price Forecast – December 18
ETH/USD Medium-term Trend: Bullish Resistance Levels: $240, $250, $280 Support Levels: $90, $80, $70 Yesterday, December 17, the price of Ethereum was in a bullish trend. The crypto’s price broke the EMAs and it was trading in the bullish trend zone as at the time of price breakout. It was suggested that the price of […] дальше »
2018-12-18 09:52 | |
|
|
Ripple (XRP) Price Could Breakout versus Bitcoin (BTC)
Ripple price found support near the 0. 000085BTC level against bitcoin. XRP seems to be now setting up for a bullish break above 0. 000092BTC resistance. Key Talking Points Ripple price is trading nicely above the 0. дальше »
2018-12-14 11:21 | |
|
|

Bitcoin Price Analysis: Bear Pennant Breakout Puts $1,700 Price in Sight
Another week, another low. Bitcoin’s market has been bleeding relentlessly for weeks and now, after falling 50% in value in just one month, the market has managed to break south of a major bearish consolidation pattern called a bear pennant:Figure 1: BTC-USD, 4-Hour Candles, Bear Pennant BreakoutThis is a massive bear pennant with a staggering $2,000 measured move. дальше »
2018-12-12 01:52 | |
|
|

Tether Will Soon Allow Direct Redemption of USDT — But With a High Minimum
Tether is launching a new liquidity portal, one that will finally allow the direct redemption of Tether’s stablecoin USDT back into fiat. According to a new report released on the company’s website, Tether is going to “launch a redesigned platform allowing for the verification of new customers and direct redemption of Tether to fiat. дальше »
2018-11-28 01:21 | |
|
|
Bitcoin Price Analysis: Another Red Day Pushes BTC Into Deeper Support Test
Bitcoin has tumbled again today as the market continues to see further downward movement shortly after breaking two areas of market support. So far, bitcoin is down 15% on the day — 25% in 1 week:Figure 1: BTC-USD, Daily Candles, Downward ContinuationThis drop below support is starting to display hallmarks of market capitulation. дальше »
2018-11-20 02:27 | |
|
|
Bitcoin Price Analysis: Yearly Support Breaks as Bitcoin Tests Underlying Demand
After months and months of consolidation, the yearly support finally broke and now bitcoin has found itself in the lower $5000s for the first time since 2017:Figure 1: BTC-USD, Daily Candles, Broken SupportBitcoin managed to drop a staggering 16% yesterday as the market sliced through the long held support like a knife through butter. дальше »
2018-11-16 01:28 | |
|
|
Bitcoin (BTC) Price Analysis: Short-Term Channel Breakout, Pullback Next?
Bitcoin was previously trading higher inside an ascending channel on its 1-hour chart, but support gave way to signal that bears have the upper hand. Price has also broken below the 100 SMA dynamic inflection point and is on its way to test the 200 SMA. дальше »
2018-11-9 06:59 | |
|
|
Altcoins Price Analysis: ADA/USD and IOT/USD Bull Breakout Pattern
As EOS bull momentum slow down, ADA/USD and IOT/USD are trading within a bull break out pattern and it is likely that prices will race towards immediate targets at 9. 5 cents and 90 cents. Should there be higher highs today in these two pairs as EOS/USD and XLM/USD consolidate then it points to an existing. дальше »
2018-11-6 05:00 | |
|
|
Bitcoin Price Analysis: Weekly Consolidation Hints Toward Sustained Breakout
Another week has passed as bitcoin continues to coil in a tighter and tighter consolidation. Both price and volume continue to consolidate as bitcoin decides where the next major move will be. дальше »
2018-10-31 00:19 | |
|
|
Traders Stay on the Sidelines As Bitcoins Price Stagnates
Bitcoin seems to be in a never-ending range between $6380 and $6480. The anticipated breakout never materialized, and price action is now trading right at the point of the triangle pattern which has been forming since January. дальше »
2018-10-26 17:34 | |
|
|
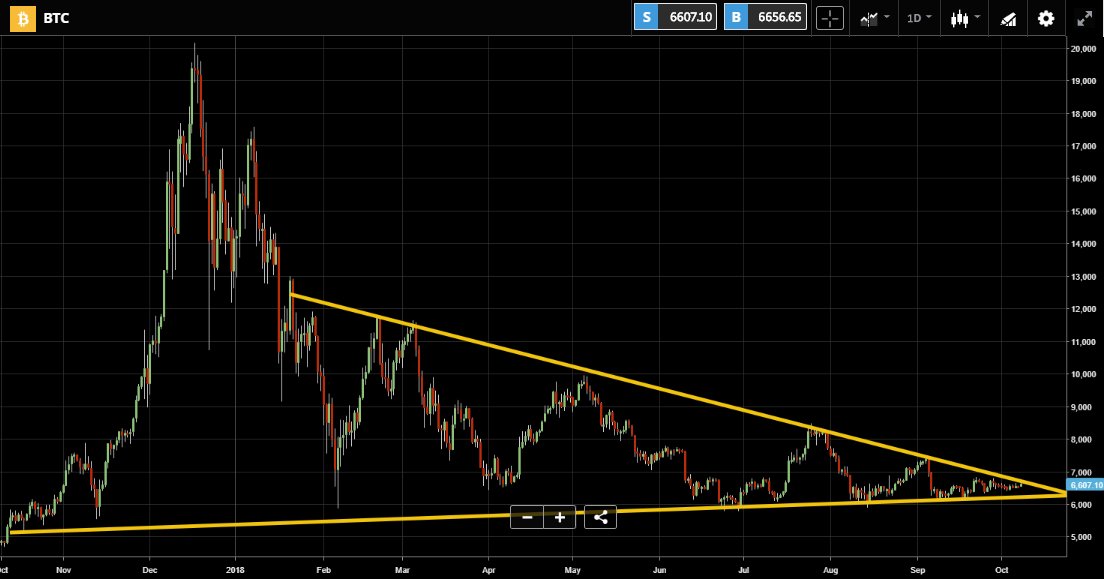
Bitcoin Price Update: Breakout Imminent as Price Looks to Move Beyond Descending Triangle
Bitcoin looks set for an imminent price breakout. The price action chart for the top-ranked cryptocurrency shows a classic breakout pattern which could potentially signal an end to the sideways trading of the last two months. дальше »
2018-10-8 19:45 | |
|
|
Ripple (XRP) Price Analysis October 8 2018, Serious Bull/Bear Battle
XRP/USD Medium-term Trend: Bearish Resistance Levels: $0. 55, $0. 60, $ 0. 70 Support Levels: $0. 44, $0. 33, $0. 22 Yesterday, October 7, XRP price was in a bearish trend. Since after the bearish breakout that broke the resistance level of $0. дальше »
2018-10-8 19:29 | |
|
|
Traders Remain Unsure of Bitcoin Direction As Volatility Hits 2018 Low
Bitcoin continues to consolidate as October progresses. Price action is trading around the end of the triangle pattern which has been forming since January. In previous articles, we outlined three potential scenarios which could play out. дальше »
2018-10-8 17:29 | |
|
|

Bitcoin Price Watch: Currency Still Unmoving, though a Breakout Is Still Possible
At press time, the father of cryptocurrency is still trading in the $6,500 range. Nothing has been altered in bitcoin’s present course; it’s stayed in this range for the past several days and isn’t looking to move. дальше »
2018-10-7 00:48 | |
|
|
Bitcoin [BTC] Continues Consolidation as Bulls and Bears Battle
Bitcoin is continuing its consolidation as the bulls, and the bears seem unsure on where to place positions for the next breakout. The daily RSI has been consolidating into a triangle and trading around showing there is equal pressure from both the buyers and the sellers. дальше »
2018-10-4 16:14 | |
|
|
Litecoin Price Analysis: LTC Trading in Steep Falling Wedge Pattern as Bulls Prime Themselves for a Breakout
Litecoin has remained relatively stagnant over the past 24 hours of trading, not moving much towards the upside or… The post Litecoin Price Analysis: LTC Trading in Steep Falling Wedge Pattern as Bulls Prime Themselves for a Breakout appeared first on Invest In Blockchain. дальше »
2018-10-3 09:18 | |
|
|
Bitcoin Continues to Consolidate As Volatility Reaches Lows of 2018
Bitcoin continues to consolidate as it reaches 2018 lows regarding volatility. The Average True Range (ATR), a proxy for volatility, is currently trading at 240. At the start of 2018, ATR was trading at the enormous value of 2000. дальше »
2018-10-2 18:04 | |
|
|
Ethereum (ETH) Remains Range Bound As Price Fails To Break Past 21 EMA
Ethereum (ETH) remains range bound as ETH/USD fails to break the 21 EMA resistance on the daily time frame. The price started trading between $324 and $250 since August and has yet to break out. дальше »
2018-9-3 21:30 | |
|
|
Bitcoin Price Watch: BTC/USD Forming Breakout Pattern Above $6,600
Key Points Bitcoin price is trading in a contracting range with support above the $6,600 level against the US Dollar. There is a major contracting triangle in place with resistance around $6,740 level on the hourly chart of the BTC/USD pair (data feed from Kraken). дальше »
2018-8-28 11:48 | |
|
|
Litecoin (LTC) Aims For Trend Reversal As Price Prepares To Escape Falling Wedge
Litecoin (LTC) is trading in a falling wedge with the possibility of a breakout in the weeks ahead. The above daily chart for LTC/USD shows that Litecoin (LTC) has almost reached the extent of its movement within the falling wedge against the US Dollar (USD) and is now likely to test the downtrend resistance. дальше »
2018-8-27 21:30 | |
|
|

Crypto Market Stagnates on the Eve of the ProShares Bitcoin (ETF) Decision
Earlier this morning, during the BitMEX’s Bitcoin spike, the crypto markets looked like they were ready for a breakout as BTC almost got to levels above $7,000. BTC had increased by $400 dollars in a span of less than half an hour and was trading at $6,800. дальше »
2018-8-23 19:45 | |
|
|

Bitcoin Price Analysis: Welcome to ‘Bitcoin Purgatory’
Bitcoin seemed on the verge of a breakout above $6,650 but a failed third attempt, followed by a lack of buying interest has given bears an opportunity to snatch back control and it looks like BTC has dropped a shelf for a bit of sideways trading in the $6,200 – $6,400 range. дальше »
2018-8-19 12:00 | |
|
|
Ethereum Classic (ETC): A Hidden Gem On The Verge Of An Unprecedented Breakout
Ethereum Classic (ETC) is about to make history with an unprecedented breakout, the likes of which we have never seen before. The price is currently, trading in a diamond formation according to the ETC/USD weekly chart above, which interestingly enough, also forms the core of the Ethereum Classic (ETC) symbol. дальше »
2018-8-13 17:00 | |
|
|

Crypto trading 101: bull and bear flags; and what do they mean for the price?
If the participation increases, the asset price extends the bull or bear run, or else a trend reversal may occur. Calculating the target An asset usually mimics the pole after a bull flag breakout or bear flag breakdown. дальше »
2018-7-21 15:18 | |
|
|