Новости о Price Indicators [ Фото новости ] [ Свежие новости ] | |

Ethereum (ETH) Price Prediction 2019 – Gathering Pace To Attack The $250 Zone (Mid May Update)
Mid May Update: Technicals When in doubt, zoom out – an old trading adage that implies a better understanding of the market when looked in bird perspective. ETHUSD weekly formed a bullish ascending triangle and ETH broke out of it on $183 level. дальше »
2019-5-15 00:08 | |
|
|
Loopring Price Analysis: Version 3.0 releases
Loopring's decentralized protocol solution hit a major milestone in early May with the launch of version 3.0 - adding off-chain based scaling and fee optimization using Zk-Snarks. Technical indicators lean bearish, however, and LRC's price in the short term remains in the hand of speculators and not users. дальше »
2019-5-14 16:00 | |
|
|
Bitcoin Price Falls 6% from $7,500; Is BTC Really Vulnerable to Plunge below $6,000?
By CCN: In the past 24 hours, following an intense 25 percent rally within a seven-day span, the bitcoin price has slightly retraced to around $7,000 from its peak at $7,500, by nearly 6 percent. Several technical analysts expected a minor retracement to occur as the bitcoin price surged from $5,000 to $7,500 in a relatively short time frame, demonstrating a parabolic upside movement. дальше »
2019-5-13 10:17 | |
|
|
Stellar Lumens (XLM) Price Prediction 2019 – Fuel The Jets, We Might See A Take-Off After All (Mid May Update)
Mid May Update: Technicals XLMBTC is coming alive, along with the rest of the altcoins market. It doesn’t show on the daily timeframe but when we zoom in on 4H, there is an obvious increase in volume and ATR (volatility) that are usually indicators of a trend reversal. дальше »
2019-5-12 01:59 | |
|
|
Bitcoin SV Price Prediction: Long-term (BSV) Value Forecast – May 11
BSV/USD market still moves in a range around $60 mark under the sell signal of the 50-day SMA indicator. The SMA indicators need to be broken upwards to allow the bulls to set a decent direction to the north. дальше »
2019-5-11 12:42 | |
|
|
Bitcoin Price: Social Media Indicators Suggest Bears May Be Lurking
By CCN: Augmento is an artificial intelligence platform that analyzes trends and data to “augment human decision-making. ” The firm posted the results of its look into the bitcoin bear market today with an eye toward determining if crypto winter is truly over. дальше »
2019-5-11 00:00 | |
|
|
Study Shows Twitter and Google Trends Are Important To Predict Crypto Price Movements
It seems that it is possible to understand how Bitcoin behaves in the crypto market by having a look a the volume of tweets and Google Search Volume Index (SVI). As per a research conducted by the Southern Methodist University, these two values were leading price indicators for both Bitcoin (BTC) and Ethereum (ETH). Social […] дальше »
2019-5-6 18:13 | |
|
|
Twitter and Google Trends Interest Precedes Cryptocurrency Price, Study Finds
The volume of tweets and Google Search Volume Index (SVI) were found to be leading price indicators for Bitcoin and Ethereum, according to a research paper published by the Southern Methodist University. дальше »
2019-5-6 05:00 | |
|
|
Verge (XVG) Price Prediction 2019 – Gravitating Towards Zero (Early May Update)
Early May Update: Technicals XVGBTC daily chart looks anemic as XVG struggles to hold its long-term support zone at around 150 sats, falling back to the current 139 satoshis. It is sitting the bottom Bollinger band with RSI signalling oversold conditions, typically all indicators of a trend reversal. дальше »
2019-5-2 01:50 | |
|
|
IOTA Price Prediction Today: Daily (MIOTA) Value Forecast – April 29
IOTA/USD market has managed to push northwards out of ranges to now be on increase. The indicators of 50-day SMA and the Bollinger Middle Band would have to play vital roles in determining the invalidity of the current market's upswing. дальше »
2019-4-29 14:23 | |
|
|
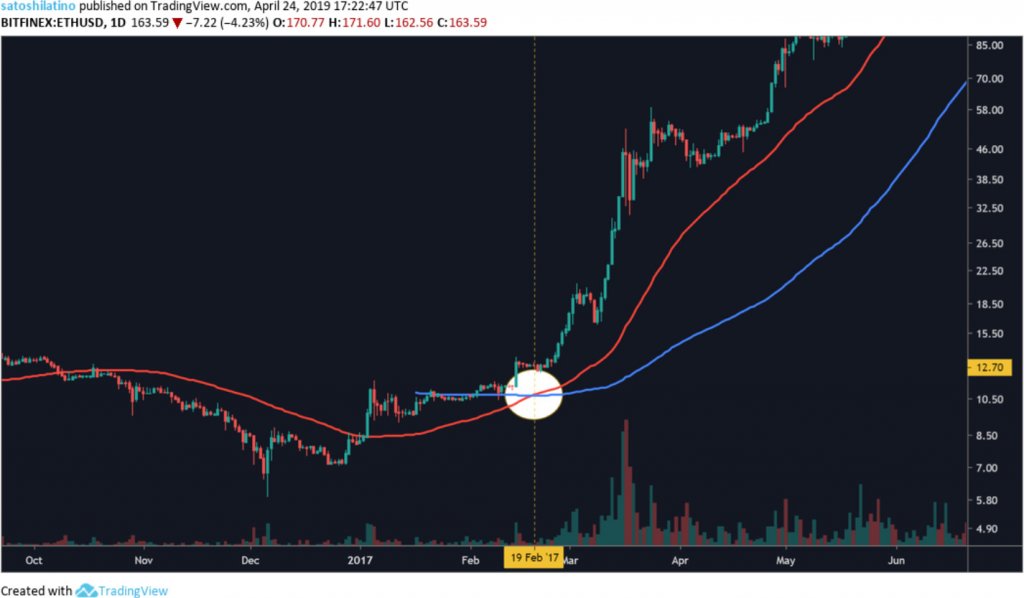
Ethereum forming bullish technical indicators
After a 2x upward movement in price, Ethereum (ETH), the world’s biggest smart-contract blockchain, has formed its first bullish golden cross since Feb. 19, 2017. Understanding the Moving Averages Prior to diving into a price analysis of the second largest cryptocurrency in terms of market cap, some of the technical terms used in this study […] The post Ethereum forming bullish technical indicators appeared first on CryptoSlate. дальше »
2019-4-25 03:11 | |
|
|

Adamant Capital: BTC Price Bottom Is Likely In, Accumulation Phase Has Begun
Bitcoin fund Adamant Capital is convinced that the bottom of the bear market is in, and true to its name, the firm has laid out an unwavering case for this position with some persuasive hard data and fundamental analysis. дальше »
2019-4-20 22:59 | |
|
|
Key Bitcoin Indicators Rage Bullish as Crypto Gains $40 Billion in 1 Month
By CCN. com: Over the past 24 hours, the bitcoin price briefly surpassed the $5,300 mark in a short-term spike but retraced back to the $5,200 region. In the past 30 days, as the bitcoin price gained 31. дальше »
2019-4-19 11:54 | |
|
|
NEO Price Prediction: Long-term (NEO) Value Forecast – April 14
NEO/USD trade has been falling in sequential order since April 6 after obtaining a high mark at $14. While the NEO/USD market couldn't break past either of its two SMA indicators northwards or southwards, there would room for range price movements. дальше »
2019-4-14 13:32 | |
|
|
Bitcoin [BTC]: Fundstrat’s Thomas Lee says BTC’s price will be $14,000 this year
Fundstrat’s Thomas Lee spoke about Bitcoin and the bullish indicators it has triggered, during a discussion with Fox Business on April 12. He compared it to the S&P 500, while also attempting to pinpoint Bitcoin’s price for 2019. дальше »
2019-4-14 18:30 | |
|
|

Bitcoin Celebrates 400 Millionth Transaction, Adoption at All Time High
Despite the consolidation in price over the last week, Bitcoin is getting strong indicators that the most recent rally will be different from the exponential price jumps experienced in 2017. While current traders may be. дальше »
2019-4-10 18:54 | |
|
|

Why Bitcoin Rallied: Three Factors That No One Is Talking About
There is rarely a single reason why Bitcoin suddenly rallies, but analysts have entertained several theories about the past week’s rally. Speculators and pundits have suggested a myriad of catalysts involving short squeezes, April Fool’s articles and various technical indicators. дальше »
2019-4-9 00:08 | |
|
|
Past Indicators Suggest Bitcoin’s Price Will Surge by More than 200% in the Future
A quick look at some of the data available on The Nasdaq shows us that following the dotcom bubble of the late 90’s (as well as the financial meltdown of 2008), both of these markets then proceeded to more than doubled in value — thereby pointing to the fact that Bitcoin too could be in […] дальше »
2019-4-8 13:45 | |
|
|
Bitcoin Price: Why the Nasdaq Dotcom Bubble Suggests BTC Will Surge 200%
The Nasdaq, which plunged in value following both the dotcom bubble and financial crisis, more than doubled in value in the following five years of post-bubble recovery. Like the Nasdaq, bitcoin could recover rapidly in the medium-term, analysis suggests. дальше »
2019-4-7 00:00 | |
|
|
Bullish Bitcoin Technicals Thrills Analysts to Predict Next Leap Beyond $7,000
By CCN. com: As the bitcoin price slightly retraced below $5,000, the valuation of the crypto market dropped by $9 billion in the past 24 hours. However, based on technical indicators, analysts remain convinced that the $5,000 to $6,000 range will be broken by bitcoin in the near-term and $7,000 is the next reasonable step for the dominant cryptocurrency. дальше »
2019-4-4 18:10 | |
|
|
Key Bitcoin Metric Flashes Bullish for First Time in 442 Days
The bitcoin price just accomplished something it failed to do every day for more than a year, and it has speculators foaming at the mouth. For the first time in 442 days, in nearly 15 months, a positive candle of bitcoin was closed on a chart that uses a technical analysis method called the Ichimoku Cloud, a collection of indicators that demonstrate support and resistance levels. дальше »
2019-4-4 00:15 | |
|
|

Top Three Implications Mass Adoption does not Guarantee
Development into and adoption of blockchain technology is growing, and this trend has no signs of stopping. In spite of last year’s price action, more and more institutions and major players are dipping their toes into cryptocurrency. дальше »
2019-4-3 20:19 | |
|
|
NEO Price Prediction: Long-term (NEO) Value Forecast – March 24
NEO/USD market tested a mark at $10 on March 16, and since then, the pair has been hovering closely below it. The NEO/USD trading indicators still count upon seeing more choppy price movements in the next trading sessions. дальше »
2019-3-24 13:27 | |
|
|
ZCash Price Prediction: Long-term (ZEC) Value Forecast – March 24
ZEC/USD trade has been found consolidating around $60 and $50 marks. Indicators have now shown $50 market lower range mark as the first pivotal line. ZEC/USD Long-term Trend – Ranging Distribution territories: $65, $70, $75 Accumulation territories: $45, $40, $35 ZEC/USD market has now got well-defined range spots within which it has been featuring a […] дальше »
2019-3-24 12:51 | |
|
|
Bitcoin SV Price Prediction: Long-term (BSV) Value Forecast – March 23
The BSV/USD pair has been relatively showing a bearish signal, but very weak in its price action in the range. BSV/USD market may embark on a long-time trade consolidation below the two conjoint economic indicators. дальше »
2019-3-23 11:52 | |
|
|
Tezos Price Prediction Today: Daily (XTZ) Value Forecast – March 20
XTZ/USD market has now been converging around $0. 060 and $0. 55. XTZ/USD market's indicators still back the possibility of seeing more ups than lows in this crypto-market. XTZ/USD Medium-term Trend: Bullish Distribution territories: $0. дальше »
2019-3-20 16:51 | |
|
|
Monero Price Analysis - Near Term Bullish Momentum Likely
Technicals suggest the possibility of respite from the bear trend, with mean reversion likely in the near future. Trend indicators including EMAs, Pitchfork, and the Ichimoku Cloud yield the potential for targets of ~US$75 within the next few weeks. дальше »
2019-3-18 14:01 | |
|
|
Monero Price Analysis - Near term bullish momentum likely
Technicals suggest the possibility of respite from the bear trend, with mean reversion likely in the near future. Trend indicators including EMAs, Pitchfork, and the Ichimoku Cloud yield the potential for targets of ~US$75 within the next few weeks. дальше »
2019-3-19 14:01 | |
|
|
NEO Price Prediction: Long-term (NEO) Value Forecast – March 17
NEO/USD market still maintains its choppy market movement around $10 and $8 marks. Indicators yet align with the possibility of seeing a number of declines in the valuation of the pair in a near time. дальше »
2019-3-17 12:35 | |
|
|
Bitcoin Price Faces Major Resistance at $4,000 Despite Positive Indicators from Traders
This year has given an optimistic outlook on how Bitcoin is steadying its price. Institutions are starting to get involved, even with the price dump, and even Nasdaq and Bakkt are contributing to the developing industry. дальше »
2019-3-15 11:24 | |
|
|
Daily Crypto Analysis and Prediction: An upward price rally looms after a bearish run for BTC and ETH
Summary A Bull Run is looking likely after a protracted bearish rally for the various cryptos. Over the last 24 hours, both Ethereum and Bitcoin lost negligibly with all indicators pointing towards better prices in the coming days. дальше »
2019-3-13 18:48 | |
|
|

Bloomberg: Key Indicators Show Bitcoin Price Could be Losing Steam
A recent report from Bloomberg states that key Bitcoin price indicators point to another downtrend in the future
дальше »2019-3-13 04:35 | |
|
|
Crypto Market Watch: Litecoin, NANO and Binance Coin Price Analysis and Forecast
Summary Over the last 24 hours, there has been a generally bullish outlook across most pairs. Candlesticks have all turned green with all indicators pointing towards an uptrend. This follows in the sentiments of investors who have been upbeat of better prices for cryptocurrencies this year. дальше »
2019-3-8 10:24 | |
|
|
Bitcoin Miners Capitulated in Dec 2018 and it Could Signal the End of Bear Market
The biggest discussion point around Bitcoin currently, is whether or not the first-ever cryptocurrency has bottomed or not, and if the bear market will soon be ending or if a lot more pain is ahead for crypto investors. дальше »
2019-3-5 23:00 | |
|
|
Crypto Technicals Turn Bullish As Bitcoin (BTC) Ends Six-Month Downtrend
Top-Down Crypto Looks Bullish While Bitcoin’s recent price action signals almost anything but a bull rally, some analysts have begun to argue that technical indicators are starting to turn in the favor of cryptocurrencies. дальше »
2019-3-2 07:15 | |
|
|
Binance Coin (BNB) Long-term Price Analysis – February 24
BNB/USD market has been significantly having a series of lower highs in its price movements. Indicators still have it that the crypto may still stylishly break northwards into other upper range zones. дальше »
2019-2-24 11:42 | |
|
|
Lisk Price Analysis - The potential bottom of a bear trend
Technicals for the LSK/USD pair show a potential trend reversal over the next few months. Trend indicators including Pitchfork, EMAs, and Cloud show the potential for a US$2.60-US$3.20 target over the next year. дальше »
2019-2-20 14:01 | |
|
|
Using alternative indicators to confirm sentiment change and price breakouts
After the launch of JP Morgan's 'stablecoin' crypto is back in the mainstream narrative which should be a positive for the wider market if it warms public sentiment. While there is no indication this news is a turning point for the bear market it does highlight how we could use alternative indicators alongside price to confirm a breakout into the next bull run. дальше »
2019-2-21 15:00 | |
|
|
Using alternative indicators to confirm sentiment change and price bottom
After the launch of JP Morgan's 'stablecoin' crypto is back in the mainstream narrative which should be a positive for the wider market if it warms public sentiment. While there is no indication this news is a turning point for the bear market it does highlight how we could use alternative indicators alongside price to confirm a breakout into the next bull run. дальше »
2019-2-19 15:00 | |
|
|
Can Bitcoin Delta Capitalization Help Predict The Market Bottom?
There has been no shortage of price predictions over the past few months as the crypto winter lengthens. Investors and traders all want to get it at the best possible place so finding the market bottom is a big deal. дальше »
2019-2-15 08:44 | |
|
|
Ethereum Price Analysis: All Indicators Point to Bulls, ETH at $250 Very Likely
Latest Ethereum News 13 months after token prices slumped forcing many to bankruptcy, the US SEC appears to be laying down the much-needed ground rules needed to resuscitate an innovation that could shape project financing. дальше »
2019-2-12 17:06 | |
|
|
Fundstrat 2019 Crypto Outlook Report Suggests Cryptocurrencies will Soar High
The year 2019 will be a year of price gains for cryptocurrencies, according to Fundstrat 2019 Outlook. Fundstrat states in the 2019 outlook that there are several indicators that suggest the year 2019 will be favorable for cryptocurrencies. дальше »
2019-2-11 16:28 | |
|
|
Bitcoin Price Analysis: BTC Fundamental and Technical Indicators Diverge
Bitcoin price trading within tight ranges Adoption picking up, positive for BTC in the long-term Transactional volume dropping It’s all about adoption. Luckily, metrics point to increasing participation, a development which is bullish for BTC in the long term. дальше »
2019-2-7 22:00 | |
|
|
Augur Price Analysis: Novelty betting markets growing in popularity
On the back of positive speculative momentum created by the launch of the Veil platform, the REP token has emerged as a market leading alt-coin, up more than 50% since the 1st of January. Although price has slid since its initial surge, a number of technical and fundamental indicators point to good times ahead for REP. дальше »
2019-2-7 15:00 | |
|
|