Новости о Pattern Historical [ Фото новости ] [ Свежие новости ] | |

Is The Bitcoin Top Already Here? This Historical Pattern Says So
A historical pattern currently forming in a Bitcoin on-chain indicator could suggest that a top may be near for the asset, if not already in. Bitcoin SOPR Ratio Is Forming A Historical Top Pattern Right Now In a CryptoQuant Quicktake post, an analyst has discussed about a pattern regarding the SOPR Ratio. дальше »
2024-4-24 21:00 | |
|
|
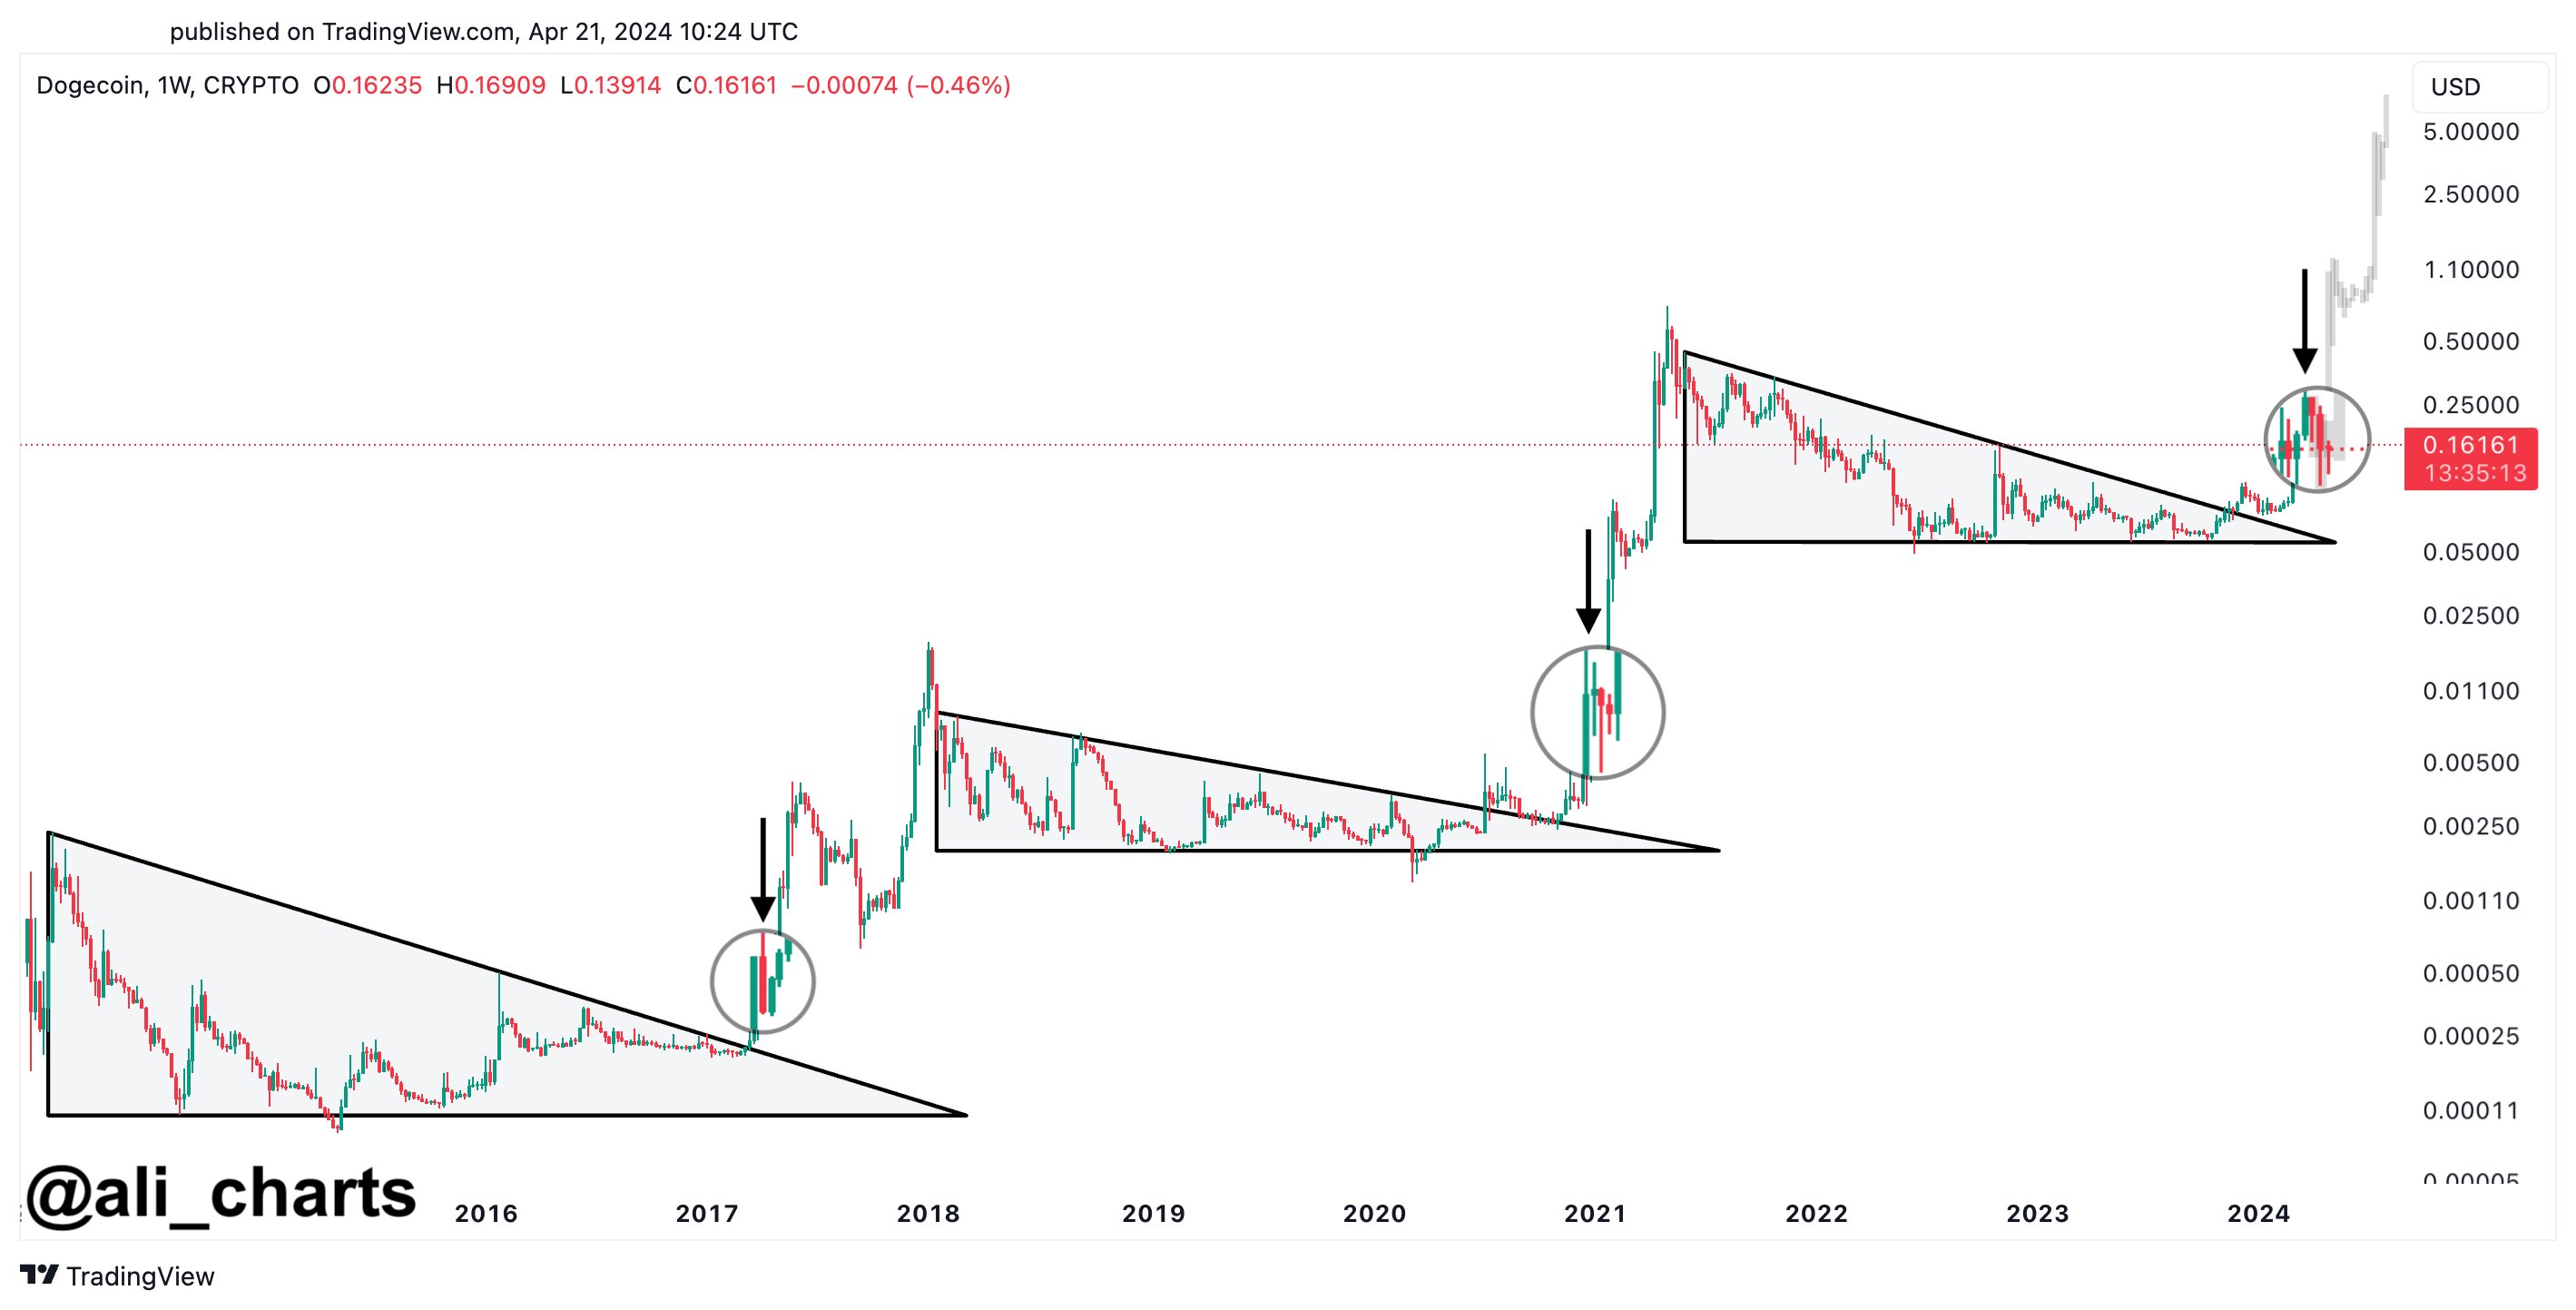
Dogecoin To $1: Analyst Thinks Dream Milestone Could Be Hit In Coming Weeks
An analyst has explained how a pattern forming in the Dogecoin price may suggest a rally to $1, if historical trend repeats this time as well. Dogecoin 1-Week Price Appears To Be Forming A Classic Pattern In a new post on X, analyst Ali has discussed how DOGE seems to have been showing a classic pattern in its weekly price once again. дальше »
2024-4-23 20:00 | |
|
|
Crypto Analyst Predicts 33,000% Move For XRP Price – Here’s The Target
Crypto analyst Javon Marks has laid out an ultra-bullish narrative for the XRP price, predicting that the crypto token’s price could increase exponentially to triple figures. The analyst also alluded to XRP’s historical price pattern to show that this price move was possible. дальше »
2024-4-19 22:00 | |
|
|

Bullets and Bitcoin: How Does War & Calamity Affect Crypto Prices?
Upon news of the April 14th Iranian attack on Israel, Bitcoin prices swiftly fell over 7% in less than 40 minutes. While initial reactions to global crises are often sharply negative, historical trends suggest a consistent recovery pattern in financial markets following such events. дальше »
2024-4-17 08:14 | |
|
|
Exec says upcoming Bitcoin halving is on a 'different scale' as...
The historical pattern suggested that Bitcoin halving often leads to value surges after the halving event. Hut 8 Mining CEO emphasized the need for large miners to adapt to low-cost operationThe post Exec says upcoming Bitcoin halving is on a 'different scale' as... appeared first on AMBCrypto. дальше »
2024-4-3 20:00 | |
|
|
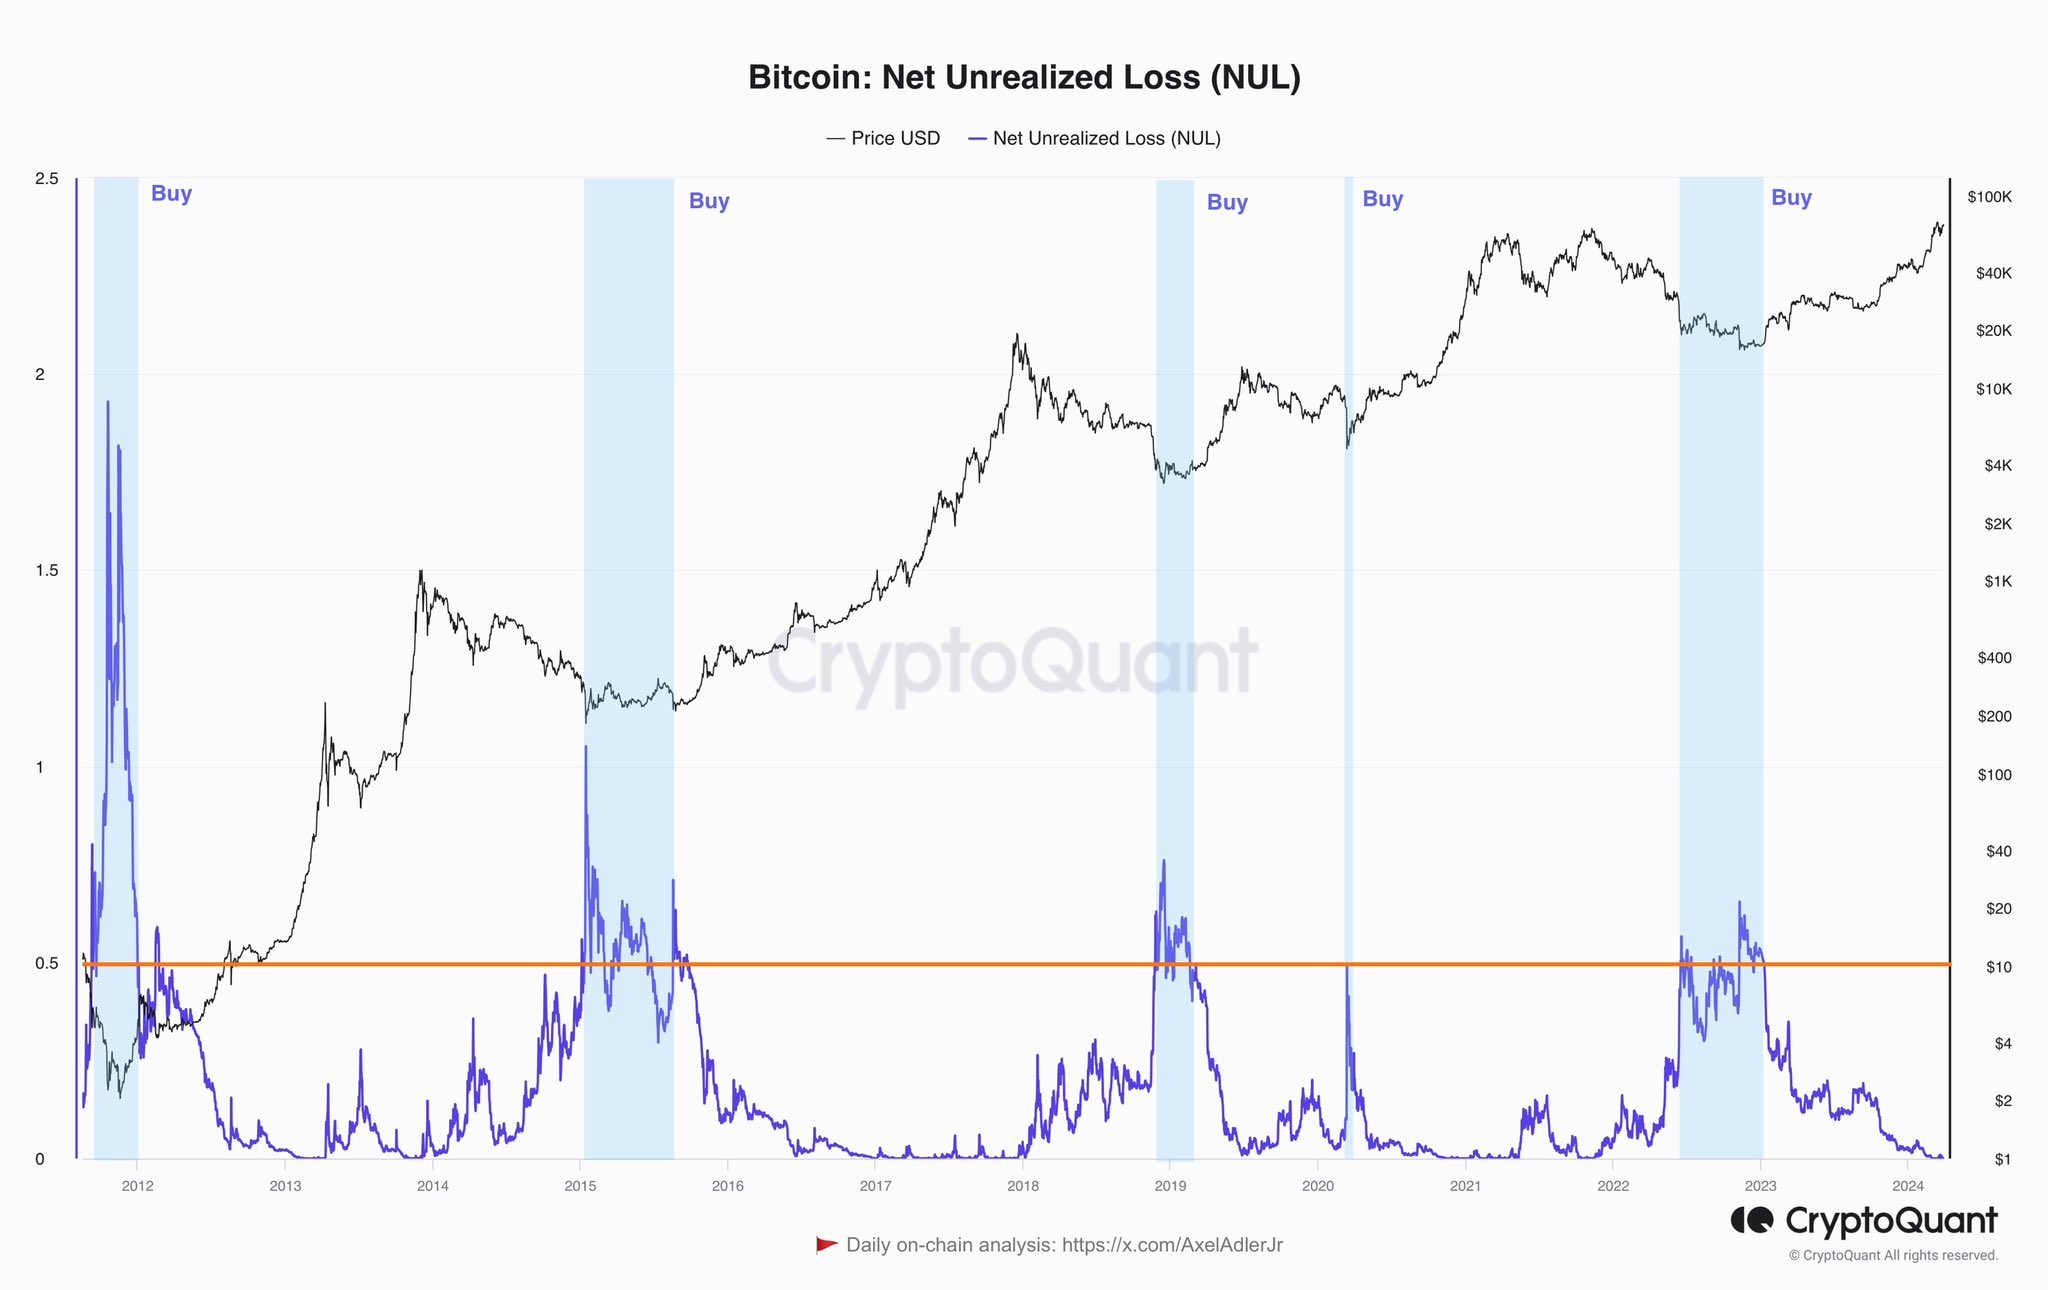
What’s A Simple Strategy For Buying & Selling Bitcoin? This Analyst Answers
An analyst has revealed a simple strategy for buying and selling Bitcoin using the historical pattern followed by two BTC on-chain indicators. These Bitcoin On-Chain Indicators Have Followed A Specific Pattern Historically In a post on X, CryptoQuant author Axel Adler Jr. дальше »
2024-3-31 04:00 | |
|
|
Polkadot’s Price Trajectory Mirrors 2021’s Rally: Analyst Highlights These Key Metrics
Polkadot (DOT), the decentralized blockchain protocol, is experiencing a pivotal moment in its price trajectory. Traders and investors closely monito the cryptocurrency’s performance as it attempts to replicate its historical pattern from 2021. дальше »
2024-3-17 21:30 | |
|
|
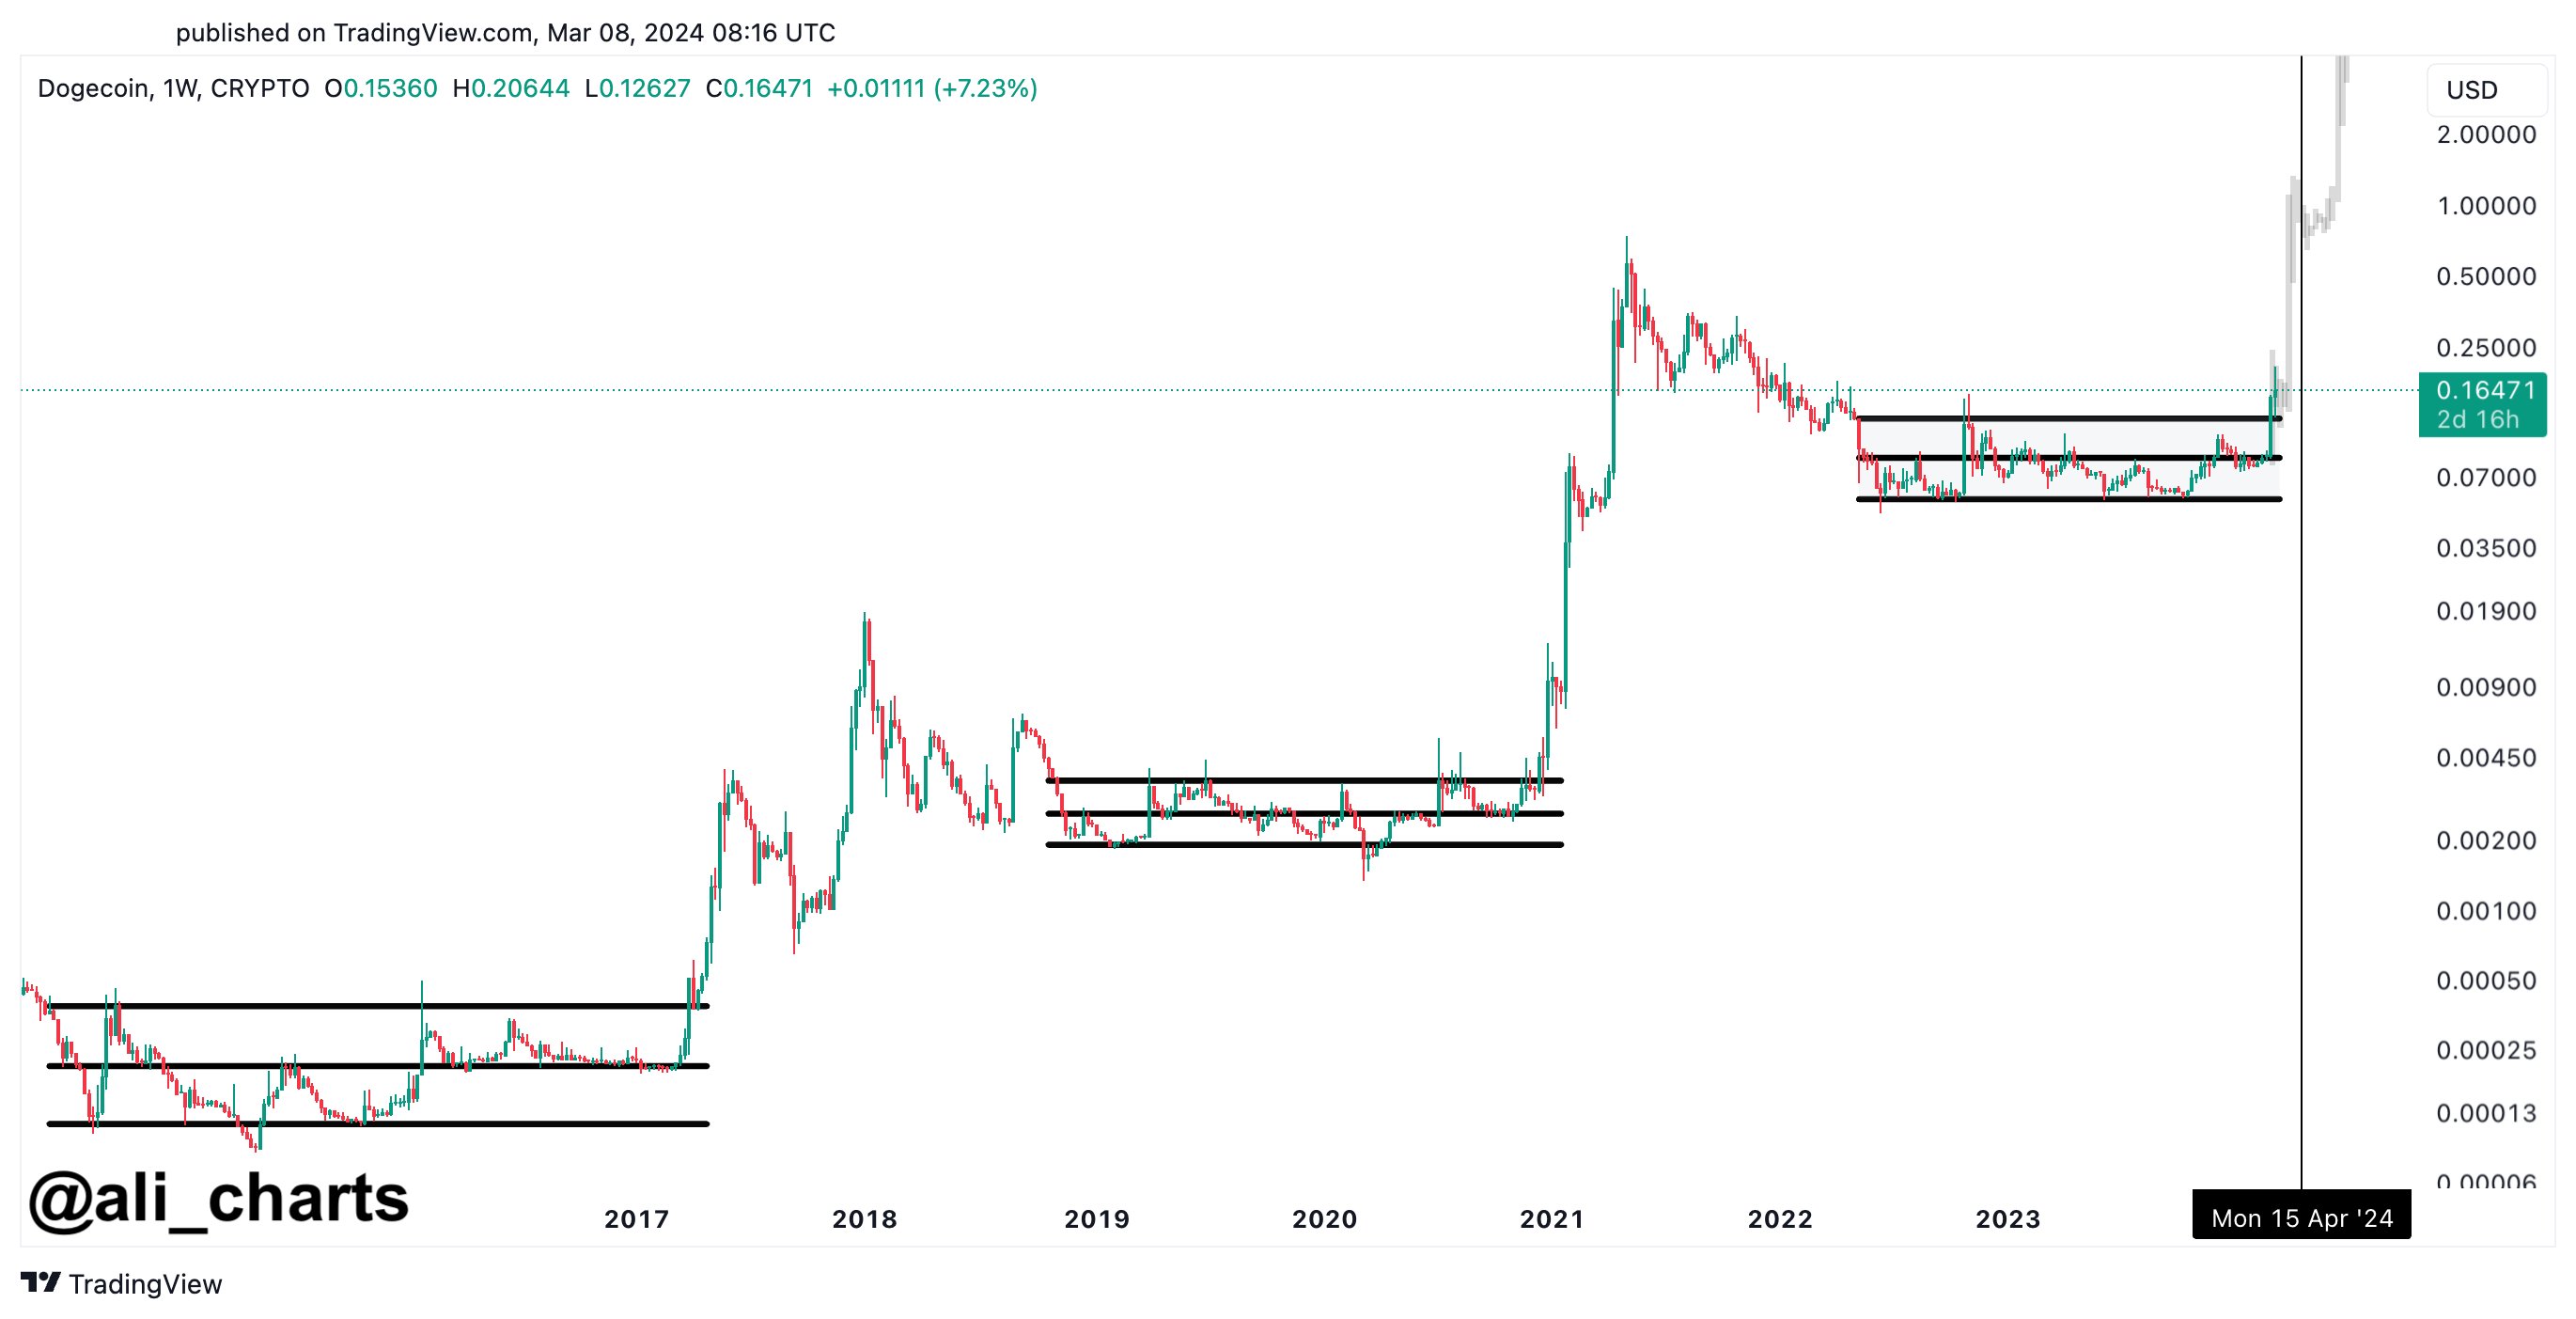
Dogecoin Could Hit $1 If History Repeats, Analyst Reveals When
An analyst has explained that Dogecoin may be able to hit $1 if history repeats for it. Here’s when exactly this could happen for DOGE. Dogecoin Has Been Breaking Out Of A Parallel Channel Recently In a new post on X, analyst Ali has discussed a potential outcome for Dogecoin based on the historical pattern. дальше »
2024-3-9 01:30 | |
|
|

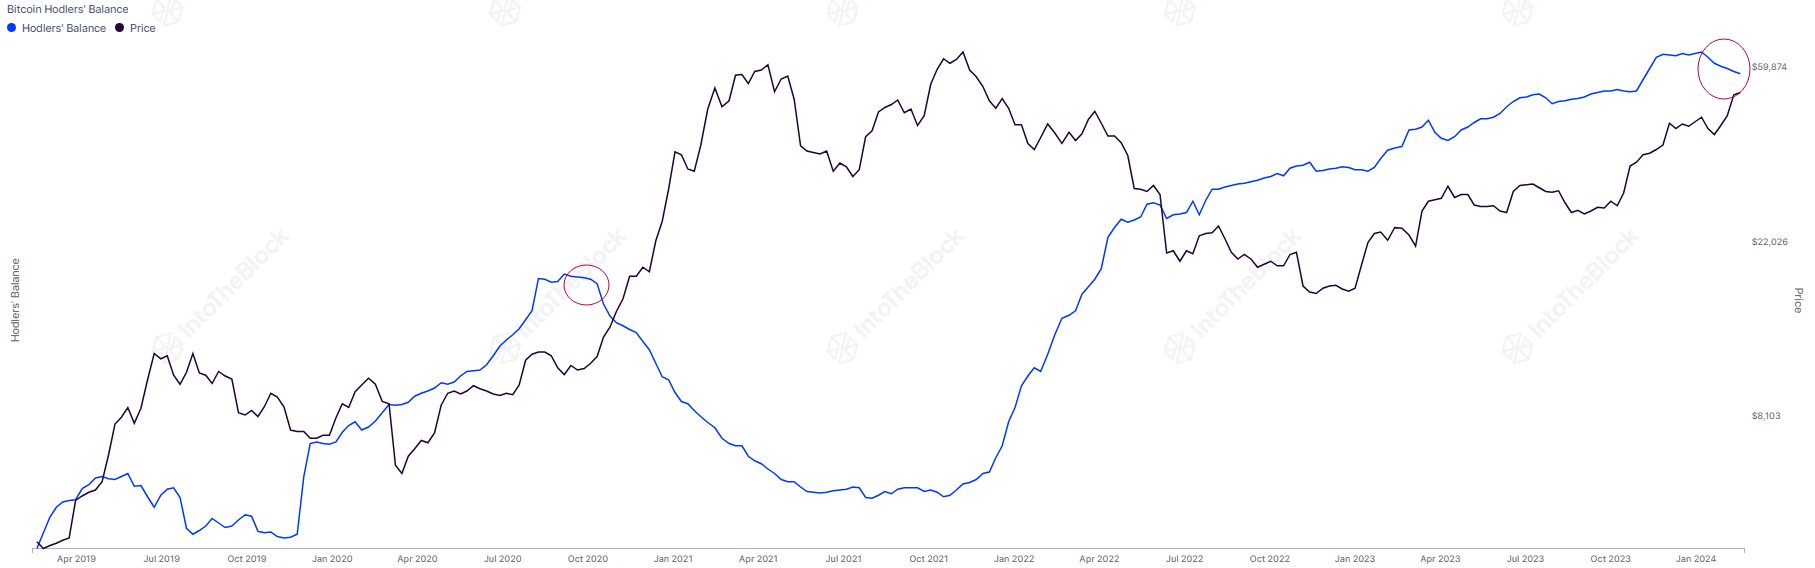
Is This Historical Bull Run Pattern Finally Forming For Bitcoin?
On-chain data suggests a Bitcoin indicator may finally form a pattern historically associated with bull runs. Bitcoin Long-Term Holders Have Reversed Their Trend Recently According to data from the market intelligence platform IntoTheBlock, the recent activity of the hodlers has been typical for bull markets in the past. дальше »
2024-2-23 03:00 | |
|
|
Solana Shows Imminent Breakout from Inverted Head and Shoulders Pattern; Analyst Predicts SOL Could Reach As High As This Level
Analyzing the SOL daily chart, Coinpedia spotlights the formation of a clear inverted head and shoulders pattern, typically signaling the end of a downtrend. SOL looks set to break above the neckline resistance around $115, which projects an ambitious upside target of $150 if historical precedents hold. дальше »
2024-2-19 12:30 | |
|
|

Bitcoin Spot To Derivatives Flow Forms Historical Bullish Pattern
On-chain data shows the Bitcoin flow from spot exchanges to derivatives exchanges is currently painting a trend that has historically been bullish for the crypto’s price. Bitcoin Spot To Derivatives Exchanges Flow Starts Sharp Decline As pointed out by an analyst in a CryptoQuant post, the BTC spot to derivatives flow may be hinting at a bullish outcome for the crypto. дальше »
2022-6-11 22:00 | |
|
|
Is Bitcoin Gonna See Another Big Drop Soon? Historical Trend May Say Yes
Historical trend of the 200-day and 600-day MAs may suggest Bitcoin could observe another big drop in the near future. Current Bitcoin Pattern Has Historically Lead To A Big Drop In The Price As pointed out by an analyst in a CryptoQuant post, the current Bitcoin price looks to be squeezed between the 200-day and 600-day MA curves. дальше »
2022-4-22 22:00 | |
|
|
Bitcoin MPI Rises To Highest Value Since March 2021, Bull Rally Soon?
On-chain data suggests the Bitcoin MPI indicator has observed a rise recently, now reaching the same values as March 2021. Past pattern may hint that a bull rally could follow here. Bitcoin MPI Seems To Be Catching Some Uptrend After Months Of Inactivity As explained by an analyst in a CryptoQuant post, the BTC MPI metric’s current trend may suggest that a bull rally could occur soon, if historical pattern is anything to go by. дальше »
2022-3-15 22:00 | |
|
|
Quant Explains How Gemini Netflow Can Predict Bitcoin Tops
Quant explains how there may be a correlation between the Gemini Bitcoin netflow and BTC price tops, based on pattern of the last few years. Can Gemini Netflow Predict Bitcoin’s Price Tops? As posted by an analyst on CryptoQuant, the historical chart for the Gemini netflow (30-day MA) vs the price reveals there could be a correlation between the indicator and BTC tops. дальше »
2021-9-15 22:00 | |
|
|
Bitcoin Historical Volatility Fractal Points To Brewing Bullish Explosion
Bitcoin price has been trapped in a tightening trading range and has barely moved in weeks. The top cryptocurrency by market cap has been boring compared to its characteristically volatile self. Looking back at the asset’s historic volatility, a fractal pattern could be forming that suggests the price per BTC is about to blast off […] дальше »
2021-7-12 21:00 | |
|
|
This Historical Pattern Shows Bitcoin Could Be Weeks Away From $75,000
Bitcoin has been trading sideways for the past month and was rejected from the $10,000 resistance level again. There is obviously a lot of uncertainty in the market, however, it’s important to remember that Bitcoin is one of the few assets that managed to recover entirely from the massive crash on March 12 due to […] дальше »
2020-6-9 23:41 | |
|
|
Analyst Predicts Bitcoin at $5,000 in Q1/2020; Here’s Why It is Compelling
While a strong bull action took the bitcoin rate up by 22 percent this week, there is still a strong likelihood of the cryptocurrency shedding all its gains. Pre-Halving Bitcoin Crashes The sentiments come in the form of a compelling historical pattern brought to notice by Jacob Canfield. дальше »
2020-1-10 15:09 | |
|
|
3 Reasons Bitcoin Will Race Toward a New Record High at $20,000
By CCN: The bitcoin price surged as much as 7. 60-percent on Friday to establish a new 2019 peak at $5,796. 93. The uptrend pushed bitcoin’s year-to-date rally to an impressive 54. 08-percent. дальше »
2019-5-4 00:10 | |
|
|
Fractal Pattern Analysis Indicates Bitcoin Could Fall to $2,500 Before Recovery
Chart and pattern analysis has been widely used to try to predict when Bitcoin and crypto markets will hit the bottom. A huge range of technical indicators combined with historical snapshots are put to work in order to tell us when the optimum time to get back in is. дальше »
2019-1-24 12:00 | |
|
|

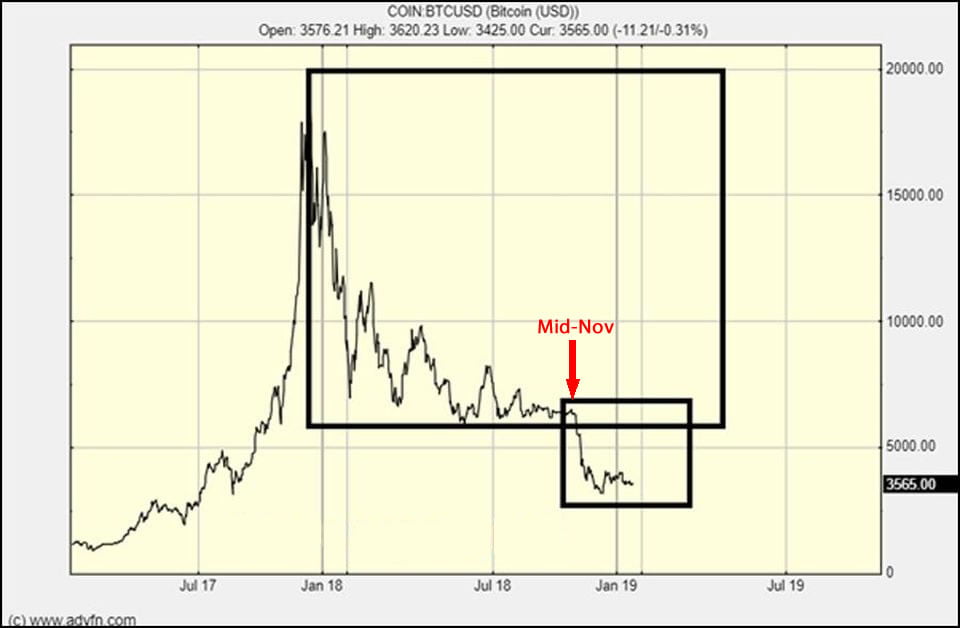
Alibaba’s secret relationship with Wikipedia and Blackwater
Clem Chambers, CEO of stocks and investment website ADVFN, believes “Bitcoin is on the ledge of another heavy fall,” but is simply following its historical pattern. At the time of this writing, Bitcoin is down 2. дальше »
2018-6-27 14:27 | |
|
|
