Новости о Pattern Chart [ Фото новости ] [ Свежие новости ] | |


Analyst Expects Bitcoin Price to Hit $27,000; Here’s Why
Bitcoin may hit $27,000 in the coming sessions, says an analyst. The analogy appeared as the cryptocurrency trends inside a Bullish Pennant structure on its monthly chart. The analyst sees BTC/USD breaking above the technical pattern and aim for an all-time high as its upside target. дальше »
2020-7-2 12:02 | |
|
|

This Altcoin Could Increase By 60% in July
The TROY (TROY) price has created a bullish reversal pattern inside a support area, indicating that it is likely to move upwards towards the current range high. Cryptocurrency trader @TheEuroSniper outlined a TROY chart, in which a short-term range between 30-47 satoshis is outlined. дальше »
2020-7-1 08:45 | |
|
|
A Chilling Bitcoin “Death Cross” Reappears With a Gloomy Stocks Correction
Bitcoin has formed a “Death Cross” pattern on its daily chart as price slips ahead of the New York opening bell. The cryptocurrency’s 50-day simple moving average today closed above its 20-day exponential moving average. дальше »
2020-6-25 16:00 | |
|
|
Bitcoin “Death Cross” Pattern that Last Crashed Price By 55% Appears Again
Bitcoin has come closer to forming a dreaded Wall Street chart pattern: the Death Cross. The bearish technical indicator materializes when an asset’s long-term moving average crosses above its short-term moving average. дальше »
2020-6-23 14:00 | |
|
|

Bitcoin Fractal That Crashed Price in March 2020 Could Appear Again
Bitcoin is looking to repeat a bearish pattern in June 2020, which has led its spot price to be lower by 60 percent. The cryptocurrency’s daily chart could form a “Death Cross” if it continues to struggle below $10,000. дальше »
2020-6-11 14:02 | |
|
|
Crucial Bearish Factor That Haunted Bitcoin Since $5ks Was Just Invalidated
A reoccurring theme in many Bitcoin analyses over the past few weeks has been mentions of a “rising wedge. ” For those unaware, a rising wedge is a common chart pattern marked by a strong uptrend. дальше »
2020-5-1 14:00 | |
|
|
Bitcoin Closes Q1 With Historic Darth Maul Candle: Here’s What it Means
Bitcoin price had one of its most volatile months yet, resulting in a massive, $6,000 long “Darth Maul” candle on the three-month price chart. But what does this rare and explosive candlestick pattern typically indicate, and what could this mean for Bitcoin price in the future? First Quarter 2020 in Crypto Closes Out More Volatile... дальше »
2020-4-2 21:00 | |
|
|

Is Bitcoin Trading Inside a Massive Reverse Head and Shoulders Pattern?
On March 7, the Bitcoin price initiated a rapid downward move that continued until the price found support at $7,700 two days later. Looking at the long-term chart since July 2019, this area could serve to create the right shoulder of a long-term inverse head and shoulders (H&S) pattern. дальше »
2020-3-11 08:20 | |
|
|

Scary Macro Chart Pattern Shows Bitcoin Could Still Be In Bear Market
Bitcoin has recovered a tiny bit today but it is still in a down trend from the 2020 high. Zooming out reveals a scarier notion and it could be that the bear market still isn’t over. Bitcoin Holding Support BTC has recovered a little since its dump below $8,600 yesterday. дальше »
2020-2-28 10:00 | |
|
|

Bitcoin’s 10% Flash Crash May Actually Satisfy This Bullish Chart Pattern
Bitcoin didn’t fare too well on Wednesday. After recovering to $10,300 from the weekend’s low of $9,500 — a gain of just over 8% — the price of the leading cryptocurrency fell off a cliff as the day came to a close on Wednesday. дальше »
2020-2-20 12:11 | |
|
|
This weird Bitcoin pattern suggests Wednesday’s 10% dump may precede a massive surge
Over the past few days, all anyone could talk about on Crypto Twitter was the golden cross that had formed on Bitcoin’s one-day chart. For those unaware, a traditional golden cross in technical analysis is when an asset’s 50-day simple moving average crosses above its 200-day moving average, suggesting that a decisive bull trend is […] The post This weird Bitcoin pattern suggests Wednesday’s 10% dump may precede a massive surge appeared first on CryptoSlate. дальше »
2020-2-20 12:00 | |
|
|
Analyst Prices Bitcoin at $400k By Next Year Based on Miner Capitulation Pattern
The Bitcoin Performance Since Difficulty Bottom chart shows the formation of a cup pattern peaking in spring 2021. This price prediction tool puts Bitcoin at an astonishing $400k by then. #bitcoin $10k … it's getting really interesting now pic. дальше »
2020-2-19 16:26 | |
|
|
Grin Price Analysis - Bullish signs emerge after a year of decline
At just over a year old, GRIN inflation remains higher than most, if not all, cryptocurrencies in an effort to distribute the coin as widely as possible. However, there is a multi-month double-bottom chart pattern, paired with a reversal of trend metrics, adding to nascent bullish confluence. дальше »
2020-2-10 14:01 | |
|
|
Litecoin Forming a Multi-Year Top Pattern May Cause an Epic Plunge
Litecoin, the silver counterpart to Bitcoin as digital gold, is often a leading indicator across the crypto market. If one particular Litecoin chart is accurate, it could be signaling an epic plunge in altcoins against Bitcoin in the coming months. дальше »
2020-2-6 20:03 | |
|
|
Bitcoin Weekly Forecast: BTC Price Primed For Bullish Break
After a strong decline, bitcoin price found support near $7,000 against the US Dollar. The price is now trading near the $7,300 and $7,320 resistance levels. There is a major breakout pattern forming resistance near $7,320 on the 4-hours chart of the BTC/USD pair (data feed from Kraken). дальше »
2019-12-29 09:00 | |
|
|
Bitcoin Rallies 5% To Clear Hurdles, Bulls Aiming $8K
Bitcoin price rallied more than 5% to clear the $7,500 resistance against the US Dollar. The price is now trading in a positive zone and it could rise further above $7,700. There is a short term breakout pattern forming with resistance near $7,590 on the hourly chart of the BTC/USD pair (data feed from Kraken). дальше »
2019-12-23 09:00 | |
|
|
Bitcoin Weekly Forecast: Is This Right Time To Buy BTC?
There was a nice upward move in bitcoin price from the $6,435 low against the US Dollar. The price is now trading nicely above the $7,000 and $6,960 support levels. There is likely a bullish continuation pattern forming resistance near $7,180 on the 4-hours chart of the BTC/USD pair (data feed from Kraken). дальше »
2019-12-22 09:00 | |
|
|
Ethereum (ETH) Could Dip And Rip Again, Bitcoin Turns Bullish
Ethereum is correcting lower from $135 and it is trading above $125 against the US Dollar. The price is likely to remain in a positive zone as long as it is above $120. There is a breakout pattern forming with resistance near $128 on the hourly chart of ETH/USD (data feed via Kraken). дальше »
2019-12-20 06:08 | |
|
|
Bitcoin Faces Another Rejection, But Here’s Why the Bull Case Remains Strong
Bitcoin has fallen into a bearish pattern of incurring major upwards movements that are followed by nearly instant rejections, which leaves behind large wicks on BTC’s candle chart and typically spells trouble for which direction it trends in the near-term. дальше »
2019-12-12 22:00 | |
|
|
Bitcoin Price: Bear Pennant Targets $4,600, Has The Breakdown Begun?
Bitcoin price has been steadily falling, locked in a downtrend over the course of the last few months, taking the price of the cryptocurrency to roughly 50% of the year’s high of $14,000. After the latest sustained drop, Bitcoin has been consolidating in what now appears to be a bear pennant chart pattern formation, which. дальше »
2019-12-11 21:00 | |
|
|

Bitcoin Price Shows ‘Uncanny Resemblance’ to 2018 Breakout Pattern
BTC has hovered between bullish and bearish attitudes. But one chart analyst sees a possible scenario, as the bitcoin price action in the past months recalls the rapid spike of BTC prices at the end of 2018. дальше »
2019-12-9 15:51 | |
|
|

Bitcoin Dominance Rate Decrease Anticipated by Analyst
The long-term chart for the Bitcoin dominance rate reveals weakness and suggests that the rate will fall. However, lower-term timeframes reveal a bullish pattern that indicates an upward move will transpire initially. дальше »
2019-12-7 10:22 | |
|
|
Binance Coin Price Analysis: Bullish Reversal On The Cards
Binance Coin has dropped to the bottom of a clear falling wedge pattern after crashing 20% against BTC pairing over the last 2 weeks. A short-term reversal could be on the cards if this particular formation plays out. дальше »
2019-8-7 20:32 | |
|
|
Bitcoin Price Forming Descending Triangle, Market Showing Consumption of Demand
As Bitcoin price struggles to maintain strength above $10,000 but is unable to push below $9,200, the crypto asset’s price chart has formed what appears to be a descending triangle – a bearish continuation pattern, that does have potential to break to the upside. дальше »
2019-8-2 23:00 | |
|
|

Bitcoin Price Analysis: BTC Prepped For Another Bearish August
Bitcoin price has almost reached maximum consolidation inside a descending triangle pattern today, having spent the last 3 days narrowly range bound between $9400 and $9580. Bitcoin Daily Chart On the daily BTC/USD chart we can see how Bitcoin has made 4 lower lows over the past 20 days and found reliable support twice at the $9,400 level. дальше »
2019-7-30 19:11 | |
|
|
Ethereum Price Chart Shows Possible Pattern to 1000% Gains Against Bitcoin
During Bitcoin’s meteoric rise to stardom and mainstream media back in 2017, another crypto asset also skyrocketed during this time. Due to the ICO boom, thousands of new ERC-20 altcoins were created on the Ethereum blockchain to take advantage of both the influx of capital from retail investors hoping to get rich and the coming. дальше »
2019-7-25 23:00 | |
|
|
Ethereum Price (ETH) Likely To Accelerate Above $240 & $250
ETH price remained well bid above the $208 support and recently climbed higher against the US Dollar. The price settled above the $220 pivot level and is currently consolidating in a range. There is a breakout pattern forming with resistance near $227 on the hourly chart of ETH/USD (data feed via Kraken). дальше »
2019-7-22 06:18 | |
|
|

Litecoin Price Analysis: LTC Leads Altcoin Recovery
Litecoin has broken the current bearish downtrend pattern after a month-long pull-back saw price levels drop around 50%. The question remains as to whether LTC and other altcoins will begin to rally higher or continue to create lower lows over the coming weeks. дальше »
2019-7-18 17:54 | |
|
|
Despite Recent Pullback, Traders still Expect Bitcoin To Hit $16K Before The End Of July
On July 10, 2019, TradingShot, stocks and crypto trading platform via a chart analysis on TradingView explained how bitcoin will surge to $16,000 this month. The prediction is based on the fact that since late April, bitcoin’s price has maintained the same pattern with three phases which has gotten it to where it is today. дальше »
2019-7-15 19:08 | |
|
|

Bitcoin Price Analysis: Whales Test Weak Hands At Key Support
Bitcoin whales are attempting to shake out emotional traders today, as the price finds itself back on the main support of a bullish pennant pattern. Will HODL’ers be able to hold their nerves at this critical time, or will panic selling force BTC out of the pennant? Let’s take a look. дальше »
2019-7-14 17:44 | |
|
|
Ethereum (ETH) Price Could Surpass $320, Bitcoin Breaks $13K
ETH price is gaining momentum above the $310 resistance area against the US Dollar. The price must break the $315 resistance area to climb above the $320 resistance zone. There is a breakout pattern forming with resistance near $314 on the hourly chart of ETH/USD (data feed via Kraken). дальше »
2019-7-10 06:08 | |
|
|

Bitcoin Price Analysis: Bulls Win Compelling Breakout
Over the last 24 hours, BTC has convincingly broken to the upside resulting in price levels hitting the bullish target set in my previous Bitcoin price analysis piece just 2 Day ago. Price action looks to now be forming a rising wedge type pattern that should see BTC re-test POC around $11,250. дальше »
2019-7-10 21:15 | |
|
|
Ethereum Price Weekly Forecast: ETH Preparing For Next Key Break
ETH price stayed above the $270-275 support and recently recovered higher against the US Dollar. Bitcoin price is currently trading above $11,000, but it is struggling to gain bullish momentum. There is a key breakout pattern forming with resistance near $295 on the 4-hours chart of ETH/USD (data feed via Kraken). дальше »
2019-7-7 07:08 | |
|
|

Bitcoin Price Analysis: BTC Falls into 2018 Bear Market Pattern
Bitcoin continues to extend it losses today, as the #1 asset unravels a further 6. 59% against the US dollar. On the 4-hour chart we can see worrying signs that the 2018 bear market could be about to repeat itself. дальше »
2019-7-2 18:33 | |
|
|
Bitcoin chart analysis against patterns of other assets highlights future possibilities, not conclusions
Chart and pattern Analysis is a major part of analysing and predicting traditional stock, commodities and cryptocurrency trading in the financial market. The price and valuation of these assets over time and different market trends are often used to gauge several metrics and predict future trends, market volatility, price direction etc. дальше »
2019-7-1 18:30 | |
|
|
Bitcoin Price Analysis: Can Bulls Gain Back Control Before July?
The recent Bitcoin price pull-back from the highs of $13,900 created a falling wedge pattern that appears to have already broken to the upside. The question remains as to whether the parabola will stay intact as we move close to the month of July. дальше »
2019-6-28 18:00 | |
|
|
Bitcoin Price Retreats From $14K, Dips Remain Attractive
There were continuing gains in bitcoin price above the $13,000 resistance against the US Dollar. The price traded close to the $14,000 level and later started a sharp bearish correction. There is a key breakout pattern forming with resistance near $12,950 on the hourly chart of the BTC/USD pair (data feed from Kraken). дальше »
2019-6-27 09:00 | |
|
|
Bitcoin Drops $2,000 in Minutes: Crypto Exchanges Struggle to Run Amid Volatility
What. The. Hell. In the past few minutes, Bitcoin (BTC) has slipped, showing an uncharacteristic bout of weakness in a massive uptrend. In fact, within the span of a few minutes, seconds maybe, Bitcoin fell from $13,800 — a year-to-date high — to just under $12,000. дальше »
2019-6-27 00:12 | |
|
|
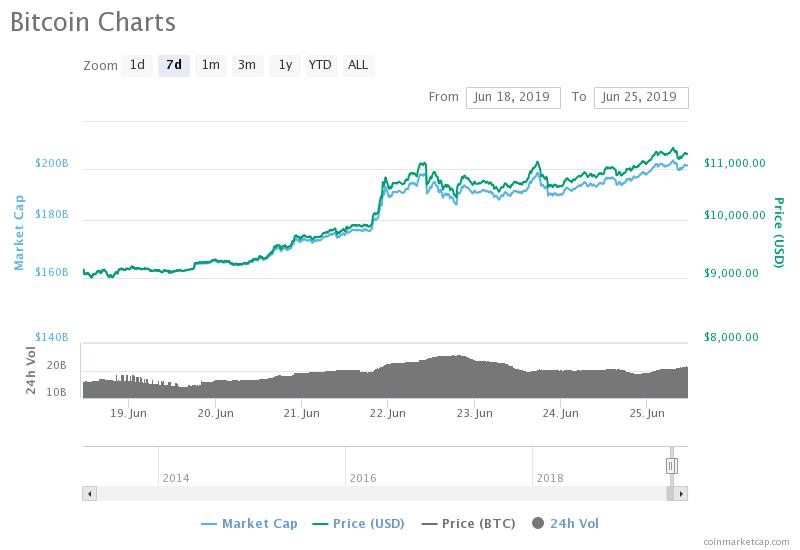
Bitcoin Price Chart: Monthly Candle Pattern Shows Strongest Trend Reversal Ever
Bitcoin price is once again making headlines on mainstream media outlets, revisiting once forgotten memories of the crypto bubble of 2017, where Bitcoin’s meteoric rise captured the interest of the world and took it to its all-time high of $20,000. дальше »
2019-6-26 23:00 | |
|
|