Новости о Pattern Chart [ Фото новости ] [ Свежие новости ] | |


XRP, NEAR, Gala Price Analysis: 20 January
XRP bounced back from its five-month support after its CMF formed a bullish divergence with price. Furthermore, GALA saw a reversal pattern on its 4-hour chart while flashing bearish near-term technicThe post XRP, NEAR, Gala Price Analysis: 20 January appeared first on AMBCrypto. дальше »
2022-1-20 14:30 | |
|
|

Uniswap, Stellar, Litecoin Price Analysis: 05 January
Defying the broader sentiment, UNI poked above the 61.8% resistance level whilst Stellar formed a cup and handle pattern on its 4-hour chart. On the other hand, Litecoin continued its sideways movemenThe post Uniswap, Stellar, Litecoin Price Analysis: 05 January appeared first on AMBCrypto. дальше »
2022-1-6 23:30 | |
|
|
Binance coin, Terra, Tron Price Analysis: 03 January
Ethereum's two-day recovery made way for Tron's jump from its immediate demand zone. Further, Terra formed a reversal pattern on its 4-hour chart after displaying a slight bullish edge. Meanwhile, BinThe post Binance coin, Terra, Tron Price Analysis: 03 January appeared first on AMBCrypto. дальше »
2022-1-3 17:00 | |
|
|


Quant Explains How Gemini Netflow Can Predict Bitcoin Tops
Quant explains how there may be a correlation between the Gemini Bitcoin netflow and BTC price tops, based on pattern of the last few years. Can Gemini Netflow Predict Bitcoin’s Price Tops? As posted by an analyst on CryptoQuant, the historical chart for the Gemini netflow (30-day MA) vs the price reveals there could be a correlation between the indicator and BTC tops. дальше »
2021-9-15 22:00 | |
|
|
Ethereum Bearish Signal Goes Off As 100k ETH Flows Into Binance
Today’s Ethereum price chart may suggest the formation of a bearish pattern called the “double top”. 100k ETH also flowed into Binance. Ethereum Price Chart Shows Famous “Double Top” Bearish Formation As explained by a CryptoQuant post, the cryptocurrency formed a bearish pattern on the price chart earlier today, and at about the same time, Binance also noticed a netflow of around 100k ETH. дальше »
2021-9-8 15:54 | |
|
|

Here’s what you should know before buying Bitcoin right now
Bitcoin has been holding itself around the lower ranges of its chart for quite some time now. This consolidation has resulted in a weird pattern being repeated, one which has made investors question tThe post Here’s what you should know before buying Bitcoin right now appeared first on AMBCrypto. дальше »
2021-7-21 15:30 | |
|
|

Big bullish pattern on US dollar index chart puts Bitcoin at risk of losing $30K
A strengthening dollar could be negative for pretty much every risk asset on board, including Bitcoin, whose value boomed against the dwindling greenback after March 2020. дальше »
2021-7-17 20:28 | |
|
|

XRP Bulls Watch Out — Trading Veteran Identifies Pattern That Could Drive Price To All-Time Lows
One of the most seasoned technical analysts and chartists in the industry has delivered a dire warning about XRP, and it doesn’t bode well for the asset’s price. Peter Brandt has spotted an infamous chart pattern that he estimates could send the XRP price to all-time lows if it’s completed. XRP Is Teetering On The […] дальше »
2021-6-25 21:43 | |
|
|

XRP price will fall to new lows vs. Bitcoin if this famous chart pattern plays out
XRP price bulls watch out! The popular Head and Shoulder pattern is statistically among the most accurate trend indicators.
дальше »2021-6-25 13:04 | |
|
|

Classic bearish chart pattern forms for Bitcoin as BTC price tumbles to $32K
Bitcoin flashes a classic bearish technical pattern that could crash BTC prices to below $20,000.
дальше »2021-6-22 15:12 | |
|
|
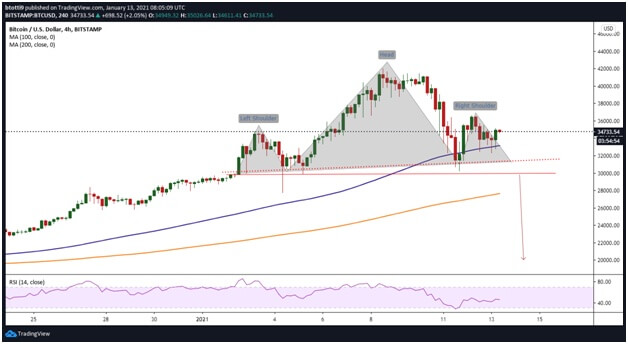
Michael Burry Predicts Bitcoin Will Follow This Pattern, Has BTC Bottomed Out?
Bitcoin has displayed high volatility during the weekend. The first cryptocurrency by market cap has lost two critical support points and, at the time of writing, trades at $34,312 with a 5. 3% loss in the daily chart. дальше »
2021-6-21 19:59 | |
|
|

Bearish or Bullish? Bitcoin Traders Argue Over Death Cross Outcome
On Saturday, cryptocurrency analysts and traders have been discussing bitcoin’s recent chart patterns and the infamous death cross pattern has been a topical conversation. A number of traders believe when bitcoin’s short-term moving average (MA) dips below the long-term MA, the crypto asset could be bracing for a major sell-off. Meanwhile, others are sure the […] дальше »
2021-6-21 18:00 | |
|
|
The Chart Pattern That Takes Ethereum To $10K
In a flash, Ethereum is back to trading under $3,000 after just weeks ago reaching a high well over $4,000. The wider crypto market correction got the best of ETH and the rest of altcoins especially, and even managed to take down Bitcoin. дальше »
2021-5-28 19:51 | |
|
|

BTC Supporters Call Price Drop a Mid-Bull Run Break, 2021 Bitcoin Chart Pattern Similar to 2013 Bull Run
After the price of bitcoin touched a high of $64,895 per unit, speculators and skeptics think it might have been the top of the bull run and a 2018-like bear run is next. On Sunday, May 23, bitcoin prices have dropped to a low of $31,107 and bears have managed to take the reigns for […] дальше »
2021-5-24 01:00 | |
|
|
Polkadot, IOTA, Dogecoin Price Analysis: 25 March
The bearish scenario across the market was reflected by Polkadot as it broke down from a bullish chart pattern. IOTA was forced to retrace all gains from a recent surge, while Dogecoin continued to faThe post Polkadot, IOTA, Dogecoin Price Analysis: 25 March appeared first on AMBCrypto. дальше »
2021-3-25 14:30 | |
|
|
Monero, Algorand, Compound Price Analysis: 01 March
Monero formed a bullish pattern on the hourly chart and could see a breakout past $220. Algorand reclaimed the $1 mark as support and pushed toward $1.15, and Compound halted its slide from $540 in miThe post Monero, Algorand, Compound Price Analysis: 01 March appeared first on AMBCrypto. дальше »
2021-3-2 21:30 | |
|
|
Bitcoin Explodes Towards $52,000 as Gold Forms Bearish Death Cross
Bitcoin achieved yet another record high in a price rally that has already seen it surging by more than 1,100 percent from its March lows last year. Incidentally, gold, which many consider Bitcoin’s top safe-haven rival, painted a death cross pattern on its daily chart. дальше »
2021-2-18 16:00 | |
|
|
Chainlink (LINK) Reaches New All-Time High but Shows Signs of Weakness
Chainlink is showing bearish signs. A breakdown from the current pattern could cause a descent towards $22. 80. Chainlink Weekly Outlook The weekly chart shows that LINK has been increasing since breaking out from and re-testing the previous all-time high resistance area at $19. дальше »
2021-2-12 13:59 | |
|
|
Bitcoin Cash, Monero, IOTA Price Analysis: 02 January
Bitcoin Cash formed a bullish triangle pattern on the chart and could see a move to the upside after testing the $326 level of support. Monero plunged on the news of delisting privacy coins on BittrexThe post Bitcoin Cash, Monero, IOTA Price Analysis: 02 January appeared first on AMBCrypto. дальше »
2021-1-3 20:00 | |
|
|
This Bearish Chart Pattern Could Cut The Crypto Altcoin Market Cap by 50%
The top crypto asset has successfully set a new all-time high in 2020, but the promised altcoin season that was supposed to follow is nowhere to be found. And with Bitcoin’s momentum turning and a correction overdue, the lack of strength in altcoins could see the total crypto market cap sans BTC sliced in half, […] дальше »
2020-12-10 04:00 | |
|
|
Ethereum Drops Below Crucial Technical Pattern and Must Hold $430
Ethereum could undergo a stronger drop in the days ahead, analysts say, as the cryptocurrency slides below key support levels. Ethereum Loses Key Support Level on a Short-Term Basis: Analysis A crypto-asset analyst shared the chart below just recently, showing how the coin has moved below a rising wedge pattern. дальше »
2020-11-16 02:18 | |
|
|
Will EOS Reach $3 Once More?
The EOS price has broken out from a descending resistance line but failed to move upwards afterward. Nevertheless, the short-term chart shows a bullish pattern, from which a breakout is likely. Breakout or Fakeout? The EOS price has been falling alongside a descending resistance line since Aug 16, when it reached a high of $3. дальше »
2020-10-22 23:15 | |
|
|

Bitcoin (BTC) price approaching profit-taking zone as bulls eye $13,800
Bitcoin (BTC) price has continued its impressive bull run to trade above the $12k handle again. As predicted by Invezz a few days ago, the BTC/USD price activated the bull pennant chart pattern that is facilitating a move to $12,400. дальше »
2020-10-21 14:41 | |
|
|

Bitcoin (BTC) price could hit $12,400 next week on this chart pattern
Although still a work in progress, Bitcoin (BTC) price has created a bullish chart pattern that could potentially take the world’s largest digital coin to above $12,000 in the coming days. Elsewhere, a former Goldman Sachs executive believes BTC could trade at $1 million in 5 years. дальше »
2020-10-17 17:01 | |
|
|

Cosmos (ATOM) price could gain over 20% in October
Cosmos (ATOM) price is trading in an impressive form as it gained over 30% since October 07. The price action created a specific chart pattern that could extend the current rally for over 20%. Fundamental analysis: Stargate upgrade to enhance strength Cosmos has announced a new 3-month bug bounty and it doubled its rewards ahead of the forthcoming Stargate upgrade in an effort to enhance its robustness. дальше »
2020-10-13 20:51 | |
|
|
Troubles for Bitcoin Grow as Analyst Spots “Potential Death Cross”
Bitcoin is on the verge of painting a Death Cross. The technical chart pattern–which forms after an asset’s short-term moving average closes below its long-term moving average–holds credibility for predicting bearish markets. дальше »
2020-10-7 11:01 | |
|
|
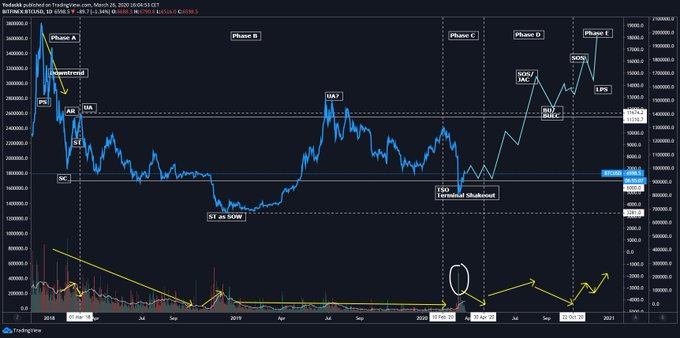
Chart Pattern That Predicted Bitcoin’s Ongoing Rally: More Upside to Come
In March, few expected Bitcoin to be in the place that it currently is in. The coin is up over 200% since the lows of March, showing that the crypto market is far from dead. Back at the lows, there were some that feared that cryptocurrencies wouldn’t be around for much longer. дальше »
2020-9-29 15:00 | |
|
|

Neo (NEO) price may gain over 70% on this chart pattern
Neo (NEO) price is enjoying a great month as it gained to log 2-year highs at $25. 90. After breaking the $21. 00 handle, the buyers activated a double bottom chart pattern which may push the price action to $36. дальше »
2020-9-27 19:32 | |
|
|

Bitcoin is Eerily Copying Gold Trends; Analyst Fears Breakdown
Bitcoin is laggingly tailing the gold chart trends, and it may face trouble for its delayed correlation. That is due to the precious metal’s latest breakdown move, wherein the price broke out of a Symmetrical Triangle pattern to the downside. дальше »
2020-9-23 11:08 | |
|
|
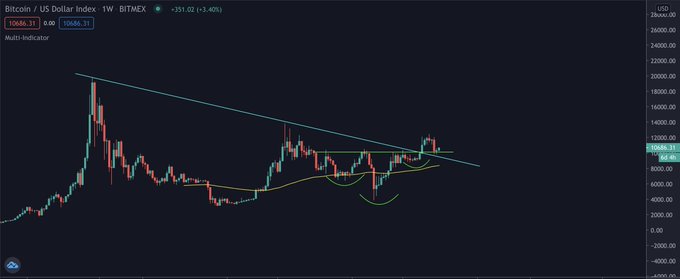
This Chart Pattern Suggests Bitcoin Is on the Verge of a Macro Bull Trend
Bitcoin has undergone a strong drop since posting a number of highs near $12,000 in August. The coin now trades at $10,700 as of this article’s writing, nearly $2,000 before the year-to-date high. дальше »
2020-9-15 13:00 | |
|
|

August 22 – Ripple (XRP) price could fall to $0.21 on this chart pattern
Ripple (XRP) price has fallen nearly 8% this week as the sellers take control of the price action. The sellers have been working on a specific bearish chart pattern that could eventually take the price action to low $0. дальше »
2020-8-23 21:29 | |
|
|
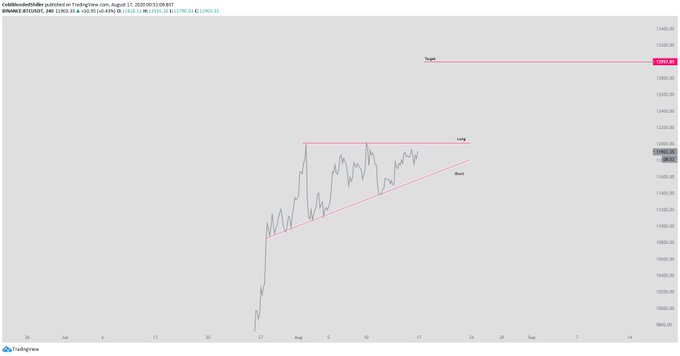
This Textbook Chart Pattern Predicts Bitcoin Will Hit $13,000 Imminently
Bitcoin has stalled despite posting a weekly close above the pivotal $11,800 level that analysts eyed. BTC remains in a textbook bullish chart pattern. That pattern is an ascending triangle, which has been a pattern of importance throughout Bitcoin’s history. дальше »
2020-8-18 13:00 | |
|
|
Binance Coin Price Analysis - Third Year Anniversary
Technicals for BNB to USD suggest a nascent bullish trend as the BNB price is now above the 200-day EMA and daily Cloud. A potential bullish chart pattern is also close to resolving, which may propel price to US$38. дальше »
2020-7-15 12:04 | |
|
|

Bitcoin’s Pattern Breakout Fails to Clear Overhead Resistance
The Bitcoin (BTC) price has been decreasing since it reached a high of $9,379 on July 7. Today, it broke out from a descending wedge, but could not sustain the higher prices. Bitcoin Short-Term Breakout The hourly chart for BC reveals that the price has been decreasing since a high of $9,379 reached on July […] The post Bitcoin’s Pattern Breakout Fails to Clear Overhead Resistance appeared first on BeInCrypto. дальше »
2020-7-8 11:55 | |
|
|