Новости о Pattern Analyst [ Фото новости ] [ Свежие новости ] | |

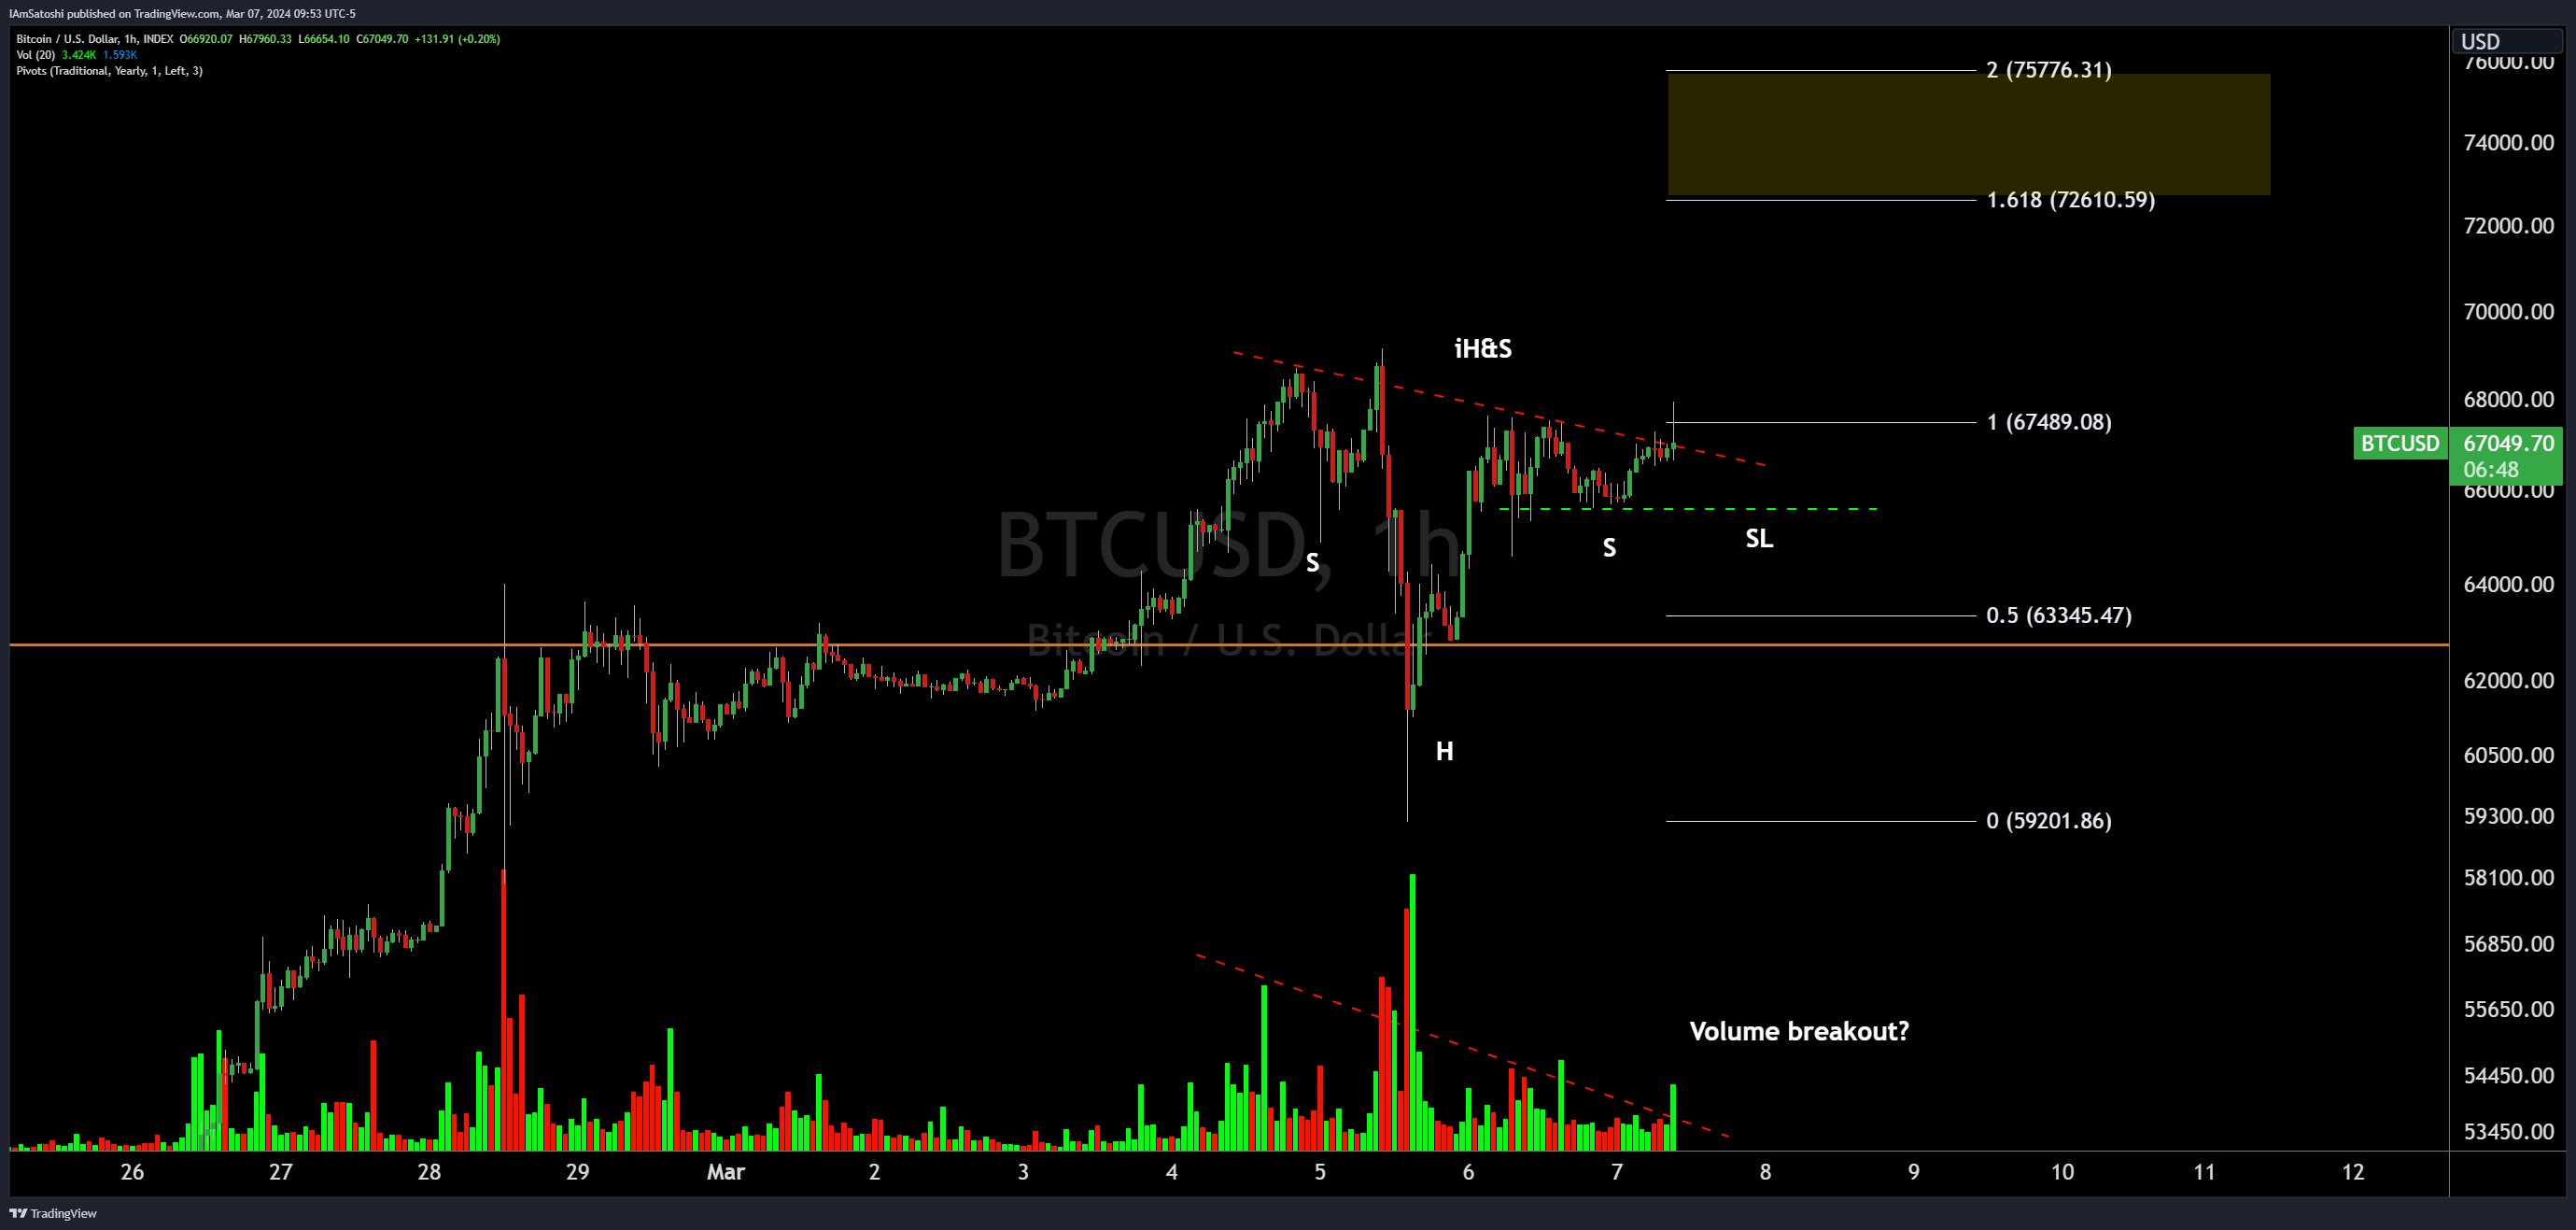
Bitcoin Price Forms Inverse Head And Shoulders Pattern, Eyes $76,000
Just below the all-time high of $69,000, the Bitcoin price has shown more volatility in recent days, only to now tread water around $67,000. But this boredom could soon be over. Following the recent price movements, a notable pattern has emerged on the Bitcoin (BTC) price chart, as recognized by the seasoned crypto analyst Josh Olszewicz. дальше »
2024-3-8 11:30 | |
|
|
Top Analyst Reveals PEPE Price Levels to Watch as Bulls Target Over 100% Spike
Popular crypto analyst Ali (@ali_charts) has revealed key price levels to watch for PEPE, as bulls target over a 100% price spike from current levels. Technical Analysis Supports Upside for PEPE According to Ali, PEPE is showing signs of forming the right shoulder of a head-and-shoulders bottoming pattern on its 3-day chart. дальше »
2024-2-24 22:30 | |
|
|
Dogecoin (DOGE) Setting Stage For Major Bull Run as Early Pattern That Led to Last +28,00% Pump Resurfaces
According to crypto analyst Ali, Dogecoin could be repeating the exact price action sequence that preceded its enormous 28,700% price explosion in 2020. With DOGE breaking out of a similar triangle pattern and consolidating, hopes are high among bulls that history could repeat itself with another parabolic leg up. дальше »
2024-2-23 13:45 | |
|
|
Solana Shows Imminent Breakout from Inverted Head and Shoulders Pattern; Analyst Predicts SOL Could Reach As High As This Level
Analyzing the SOL daily chart, Coinpedia spotlights the formation of a clear inverted head and shoulders pattern, typically signaling the end of a downtrend. SOL looks set to break above the neckline resistance around $115, which projects an ambitious upside target of $150 if historical precedents hold. дальше »
2024-2-19 12:30 | |
|
|
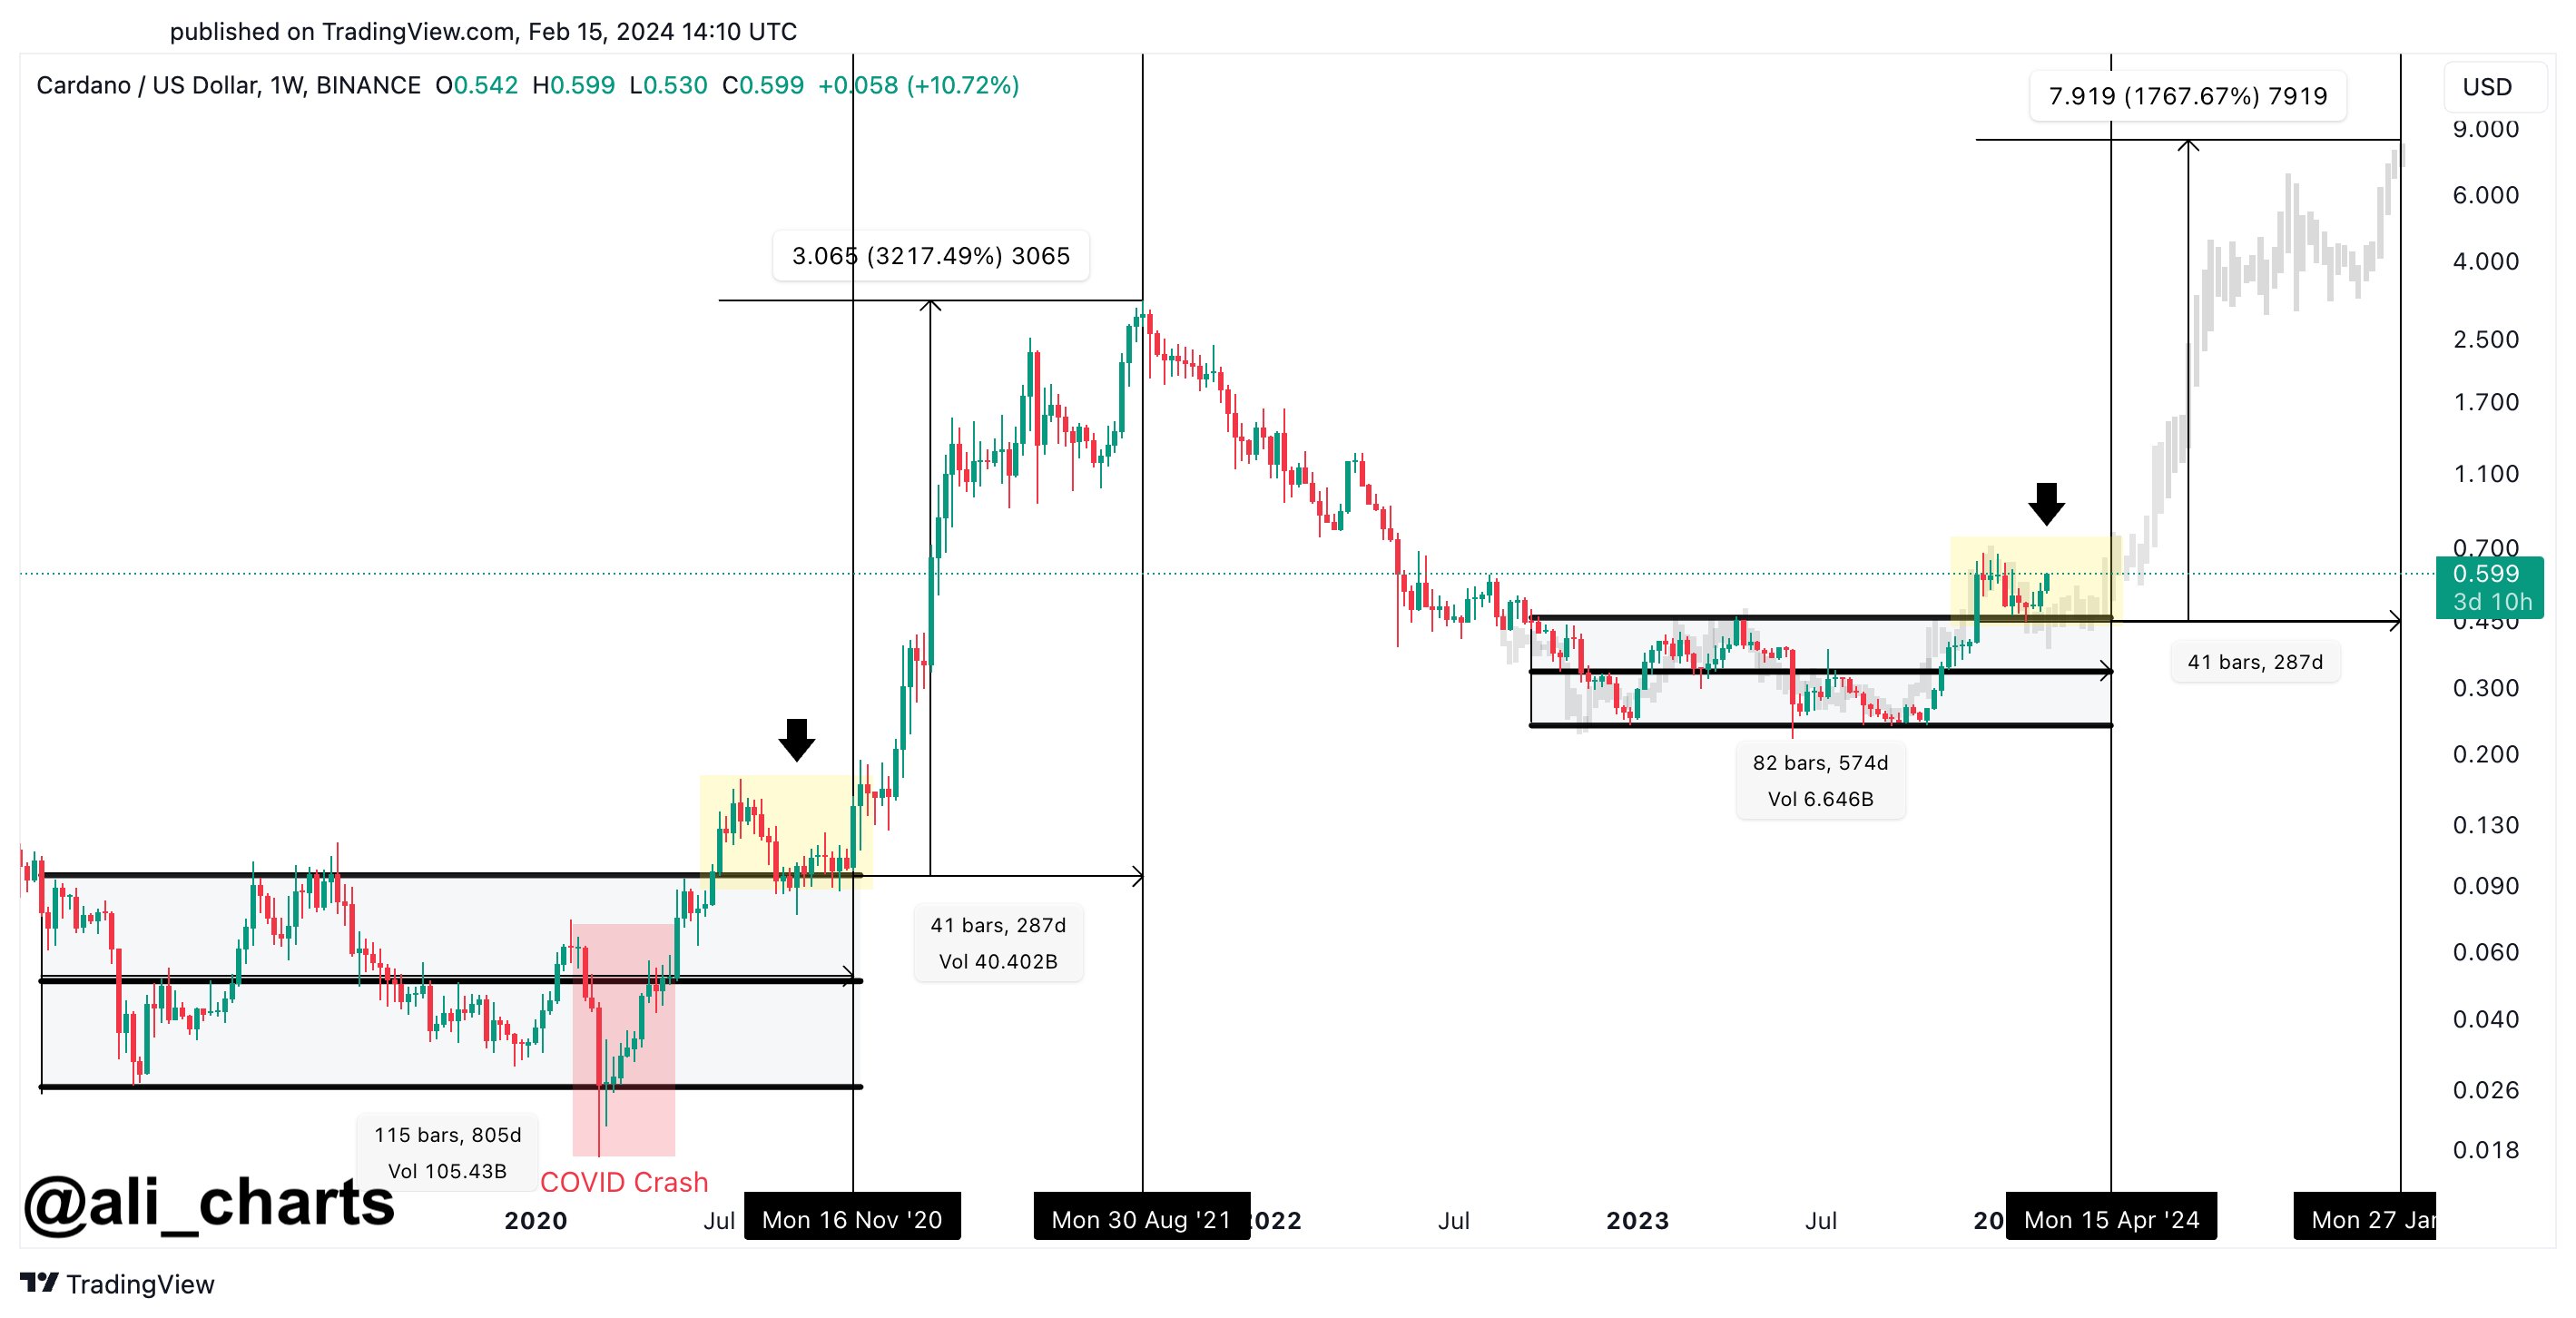
Cardano (ADA) To Break $8 In Bull Run: Analyst Predicts Timeline
An analyst has explained that if history repeats for Cardano (ADA), its price could break $8. Here’s when this might happen for the asset. Cardano Has Been Mirroring Past Price Pattern Recently In a new post on X, analyst Ali has discussed a potential breakout happening in the weekly price of Cardano. дальше »
2024-2-17 22:30 | |
|
|
SingularityNET’s AGIX Surges as Cup and Handle Pattern Breaks: How High Can the Price Go in This Move?
Cryptocurrency analyst CryptoBull_360 tweeted that AI token SingularityNET (AGIX) is breaking out from a bullish cup and handle pattern on the daily chart. This technical pattern involves a U-shaped “cup” consolidation followed by a smaller “handle” consolidation before a major breakout. дальше »
2024-2-16 17:12 | |
|
|

Cardano’s Surge To $7 ADA Price Envisioned Amid Consolidation Pattern Similar to Late 2020
Renowned crypto analyst Ali Martinez has sparked excitement among Cardano (ADA) investors by drawing parallels between the current market behaviour and that of late 2020. дальше »2024-2-14 00:05 | |
|
|
Dogecoin Faces Critical Juncture Amid Symmetrical Triangle Pattern, Analyst Lays Out Two Scenarios For DOGE
Dogecoin exhibited a slight uptick this week after eyeing a symmetrical triangle support breach on the charts. DOGE currently trades around $0. 0824, with a 3% surge in value over the last 24 hours. дальше »
2024-2-14 20:30 | |
|
|
Bullish Pennant Pattern Suggests Injective Protocol Is Ready to Surge 40% from This Price: INJ Price Outlook
Popular crypto analyst X account ChartMonkeyBTC posted a technical analysis of the Injective Protocol token (INJ). The automated post highlighted a bullish pennant pattern forming on INJ’s 12-hour price chart, suggesting the potential for a significant price increase of 35-40% soon. дальше »
2024-2-10 19:59 | |
|
|
Solana Could ‘Consolidate Inside This Huge Triangle’: Analyst Lays Out Two Scenarios For SOL
Solana’s price action continues to develop within a multi-month triangle consolidation pattern, just as a broader conviction has been waived across digital assets. However, with SOL gaining traction since its bullish upside breakout, analysts debate whether adequate momentum exists to power through macro turbulence. дальше »
2024-2-6 10:00 | |
|
|
The Most Profitable Buy Signal In Bitcoin Just Triggered
The latest trend in the Bitcoin “hash ribbon” indicator has just formed a pattern that has historically been a buy signal for the crypto. Bitcoin Hash Ribbon Buy Signal Goes Off As Miner Capitulation Comes To An End As explained by an analyst on Twitter, the BTC miner capitulation phase seems to have ended today after going on for 71 days. дальше »
2022-8-22 22:00 | |
|
|
Ethereum Investors Close 300k Long Positions on Bitfinex, Rally To Stop Soon?
Data shows around 300k in ETHUSD long positions have been closed on the Bitfinex Ethereum futures market, something that could provide impedance to the latest rally. Ethereum Long Positions Have Dropped By More Than 300k During The Last Few Days On Bitfinex As pointed out by an analyst in a CryptoQuant post, the past data of the ETHUSD long positions on the crypto exchange Bitfinex would suggest the current pattern may prove to be bearish for the value of the coin. дальше »
2022-8-10 22:00 | |
|
|

Peter Brandt: BTC Could Drop to $13,000 and Enter ‘Drano Chart Pattern’
Peter Brandt, the analyst who predicted the crypto winter of 2018, has said that Bitcoin could continue to drop to $13,000. The post Peter Brandt: BTC Could Drop to $13,000 and Enter ‘Drano Chart Pattern’ appeared first on BeInCrypto. дальше »
2022-6-16 03:43 | |
|
|
Bitcoin Spot To Derivatives Flow Forms Historical Bullish Pattern
On-chain data shows the Bitcoin flow from spot exchanges to derivatives exchanges is currently painting a trend that has historically been bullish for the crypto’s price. Bitcoin Spot To Derivatives Exchanges Flow Starts Sharp Decline As pointed out by an analyst in a CryptoQuant post, the BTC spot to derivatives flow may be hinting at a bullish outcome for the crypto. дальше »
2022-6-11 22:00 | |
|
|
Is Bitcoin Gonna See Another Big Drop Soon? Historical Trend May Say Yes
Historical trend of the 200-day and 600-day MAs may suggest Bitcoin could observe another big drop in the near future. Current Bitcoin Pattern Has Historically Lead To A Big Drop In The Price As pointed out by an analyst in a CryptoQuant post, the current Bitcoin price looks to be squeezed between the 200-day and 600-day MA curves. дальше »
2022-4-22 22:00 | |
|
|
Latest Trend In Bitcoin Realized Cap Suggests A Bullish Pattern
The current trend of the Bitcoin realized cap has formed a pattern that has historically been a bullish signal for the crypto’s price. Bitcoin Realized Cap 30-Day Rate Of Change Has Turned Positive As pointed out by an analyst in a CryptoQuant post, the BTC realized cap 30-day rate of change has just turned positive […] дальше »
2022-4-5 22:00 | |
|
|
Bitcoin Bullish Signal: 30MA STH-SOPR Returns Above 1 After 4 Months
The Bitcoin STH-SOPR (EMA-30) has now returned above a value of one for the first time in four months, a sign that could prove to be bullish for the price of the crypto. Bitcoin Short-Term Holder SOPR Has Broken Above 1 Recently As pointed out by an analyst in a CryptoQuant post, the BTC STH-SOPR is currently forming a pattern that has historically been bullish for the coin. дальше »
2022-4-5 22:00 | |
|
|
Bitcoin MPI Rises To Highest Value Since March 2021, Bull Rally Soon?
On-chain data suggests the Bitcoin MPI indicator has observed a rise recently, now reaching the same values as March 2021. Past pattern may hint that a bull rally could follow here. Bitcoin MPI Seems To Be Catching Some Uptrend After Months Of Inactivity As explained by an analyst in a CryptoQuant post, the BTC MPI metric’s current trend may suggest that a bull rally could occur soon, if historical pattern is anything to go by. дальше »
2022-3-15 22:00 | |
|
|
Is The Bitcoin Bottom In? Here’s What SOPR Data Says
Bitcoin has continued its rally breaking above $42k today, making many wonder whether $33k was the bottom. Here’s what the SOPR data says about it. Bitcoin Short-Term Holder SOPR Starts Turning Green Again As explained by an analyst in a CryptoQuant post, the current BTC SOPR pattern may look similar to that around the bottom formation back in July of last year. дальше »
2022-2-8 22:00 | |
|
|
Bitcoin Leverage Ratio Suggests More Decline May Be Coming
A quant explains why the current high Bitcoin leverage ratio values may mean that more price drop could be coming soon. Current Bitcoin Leverage Ratio Is At High Values As explained by an analyst in a CryptoQuant post, the current BTC leverage ratio has high values, and if past pattern is anything to go by, a correction may be coming to the price soon. дальше »
2022-2-4 22:00 | |
|
|
This Bitcoin Volatility Index Pattern Suggests A Short Squeeze May Be Near
The current Bitcoin volatility Index values suggest that a short squeeze may be near, if past pattern continues to hold. Past Bitcoin Volatility Index Pattern Suggests A Short Squeeze May Happen Here As explained by an analyst in a CryptoQuant post, the BTC volatility index has now reached values where a short squeeze has happened in the past. дальше »
2022-1-29 22:00 | |
|
|

2 Reasons Why Current “Frying Pan” Bottom Is Extremely Bullish For Bitcoin
Bitcoin bulls could be on to something splendid after price printed a bullish reversal pattern on Thursday, days after losing grip of the $53,000 support. According to Mathew Hayland, a seasoned crypto technical and on-chain analyst, Bitcoin’s price is slowly forging a pattern that could ignite a spirited bullish run once various conditions are met. […] дальше »
2021-12-24 16:47 | |
|
|

Analysis: Litecoin trading pattern is prerequisite for bullish movement
The near-term outlook of Litecoin (LTC/USD) appears favorable as the altcoin’s trading patterns indicate a bullish trend. These predictions are backed by bullish crossover on the Directional Movement Index (DMI), a northbound RSI, and growth in 24-hour trading volumes, CoinFi writes, citing data from crypto analyst firm AMB Crypto. дальше »
2021-10-15 17:40 | |
|
|
Stablecoins Reserve Surges Up Again, Dry Powder For Bitcoin’s Next Big Move?
Data shows stablecoins volume has surged up once again. Past pattern may suggest that this accumulation could be dry powder for Bitcoin’s next big move. Bitcoin Stablecoins Reserve Rises Up Again As pointed out by an analyst in a CryptoQuant post, the stablecoins reserve seems to have risen again back to peak levels. дальше »
2021-9-28 22:00 | |
|
|
Quant Explains How Gemini Netflow Can Predict Bitcoin Tops
Quant explains how there may be a correlation between the Gemini Bitcoin netflow and BTC price tops, based on pattern of the last few years. Can Gemini Netflow Predict Bitcoin’s Price Tops? As posted by an analyst on CryptoQuant, the historical chart for the Gemini netflow (30-day MA) vs the price reveals there could be a correlation between the indicator and BTC tops. дальше »
2021-9-15 22:00 | |
|
|


Bulls Battle Bears as Bitcoin Price Risks Decline to $51,000; Here’s Why
Bitcoin prices will likely hit $51,000, according to a technical setup presented by an independent analyst. The pseudonymous Twitterati spotted the BTC/USD exchange rate breaking below a bearish continuation pattern. дальше »
2021-4-21 17:27 | |
|
|
Bitcoin Will Not Go Down Below $28,000, Asserts On-Chain Analyst
Many traders agree that the pair could continue its move lower, forming a potential Head and Shoulder pattern, a bearish reversal structure. дальше »
2021-1-13 14:21 | |
|
|
Bitcoin Analyst Warns Price Could Dip Below $20,000; Here’s Why
The cost of one Bitcoin could end up plunging below its 2017’s record high of $20,000. That is, according to a pseudonymous analyst, who determined the cryptocurrency’s bearish outlook based on a classic head and shoulder pattern. дальше »
2021-1-13 09:00 | |
|
|

Analyst: Ethereum Forming Extremely Bullish Pattern as Bulls Target New Highs
Ethereum and the entire crypto market is consolidating today following some recent turbulence Bulls stepped up after the entire market saw a massive selloff yesterday and absorbed the influx of selling pressure, allowing BTC to rocket past $40,000 and ETH to move higher Today, the market has consolidated and drifted slightly lower, although bulls still […] дальше »
2021-1-9 01:38 | |
|
|
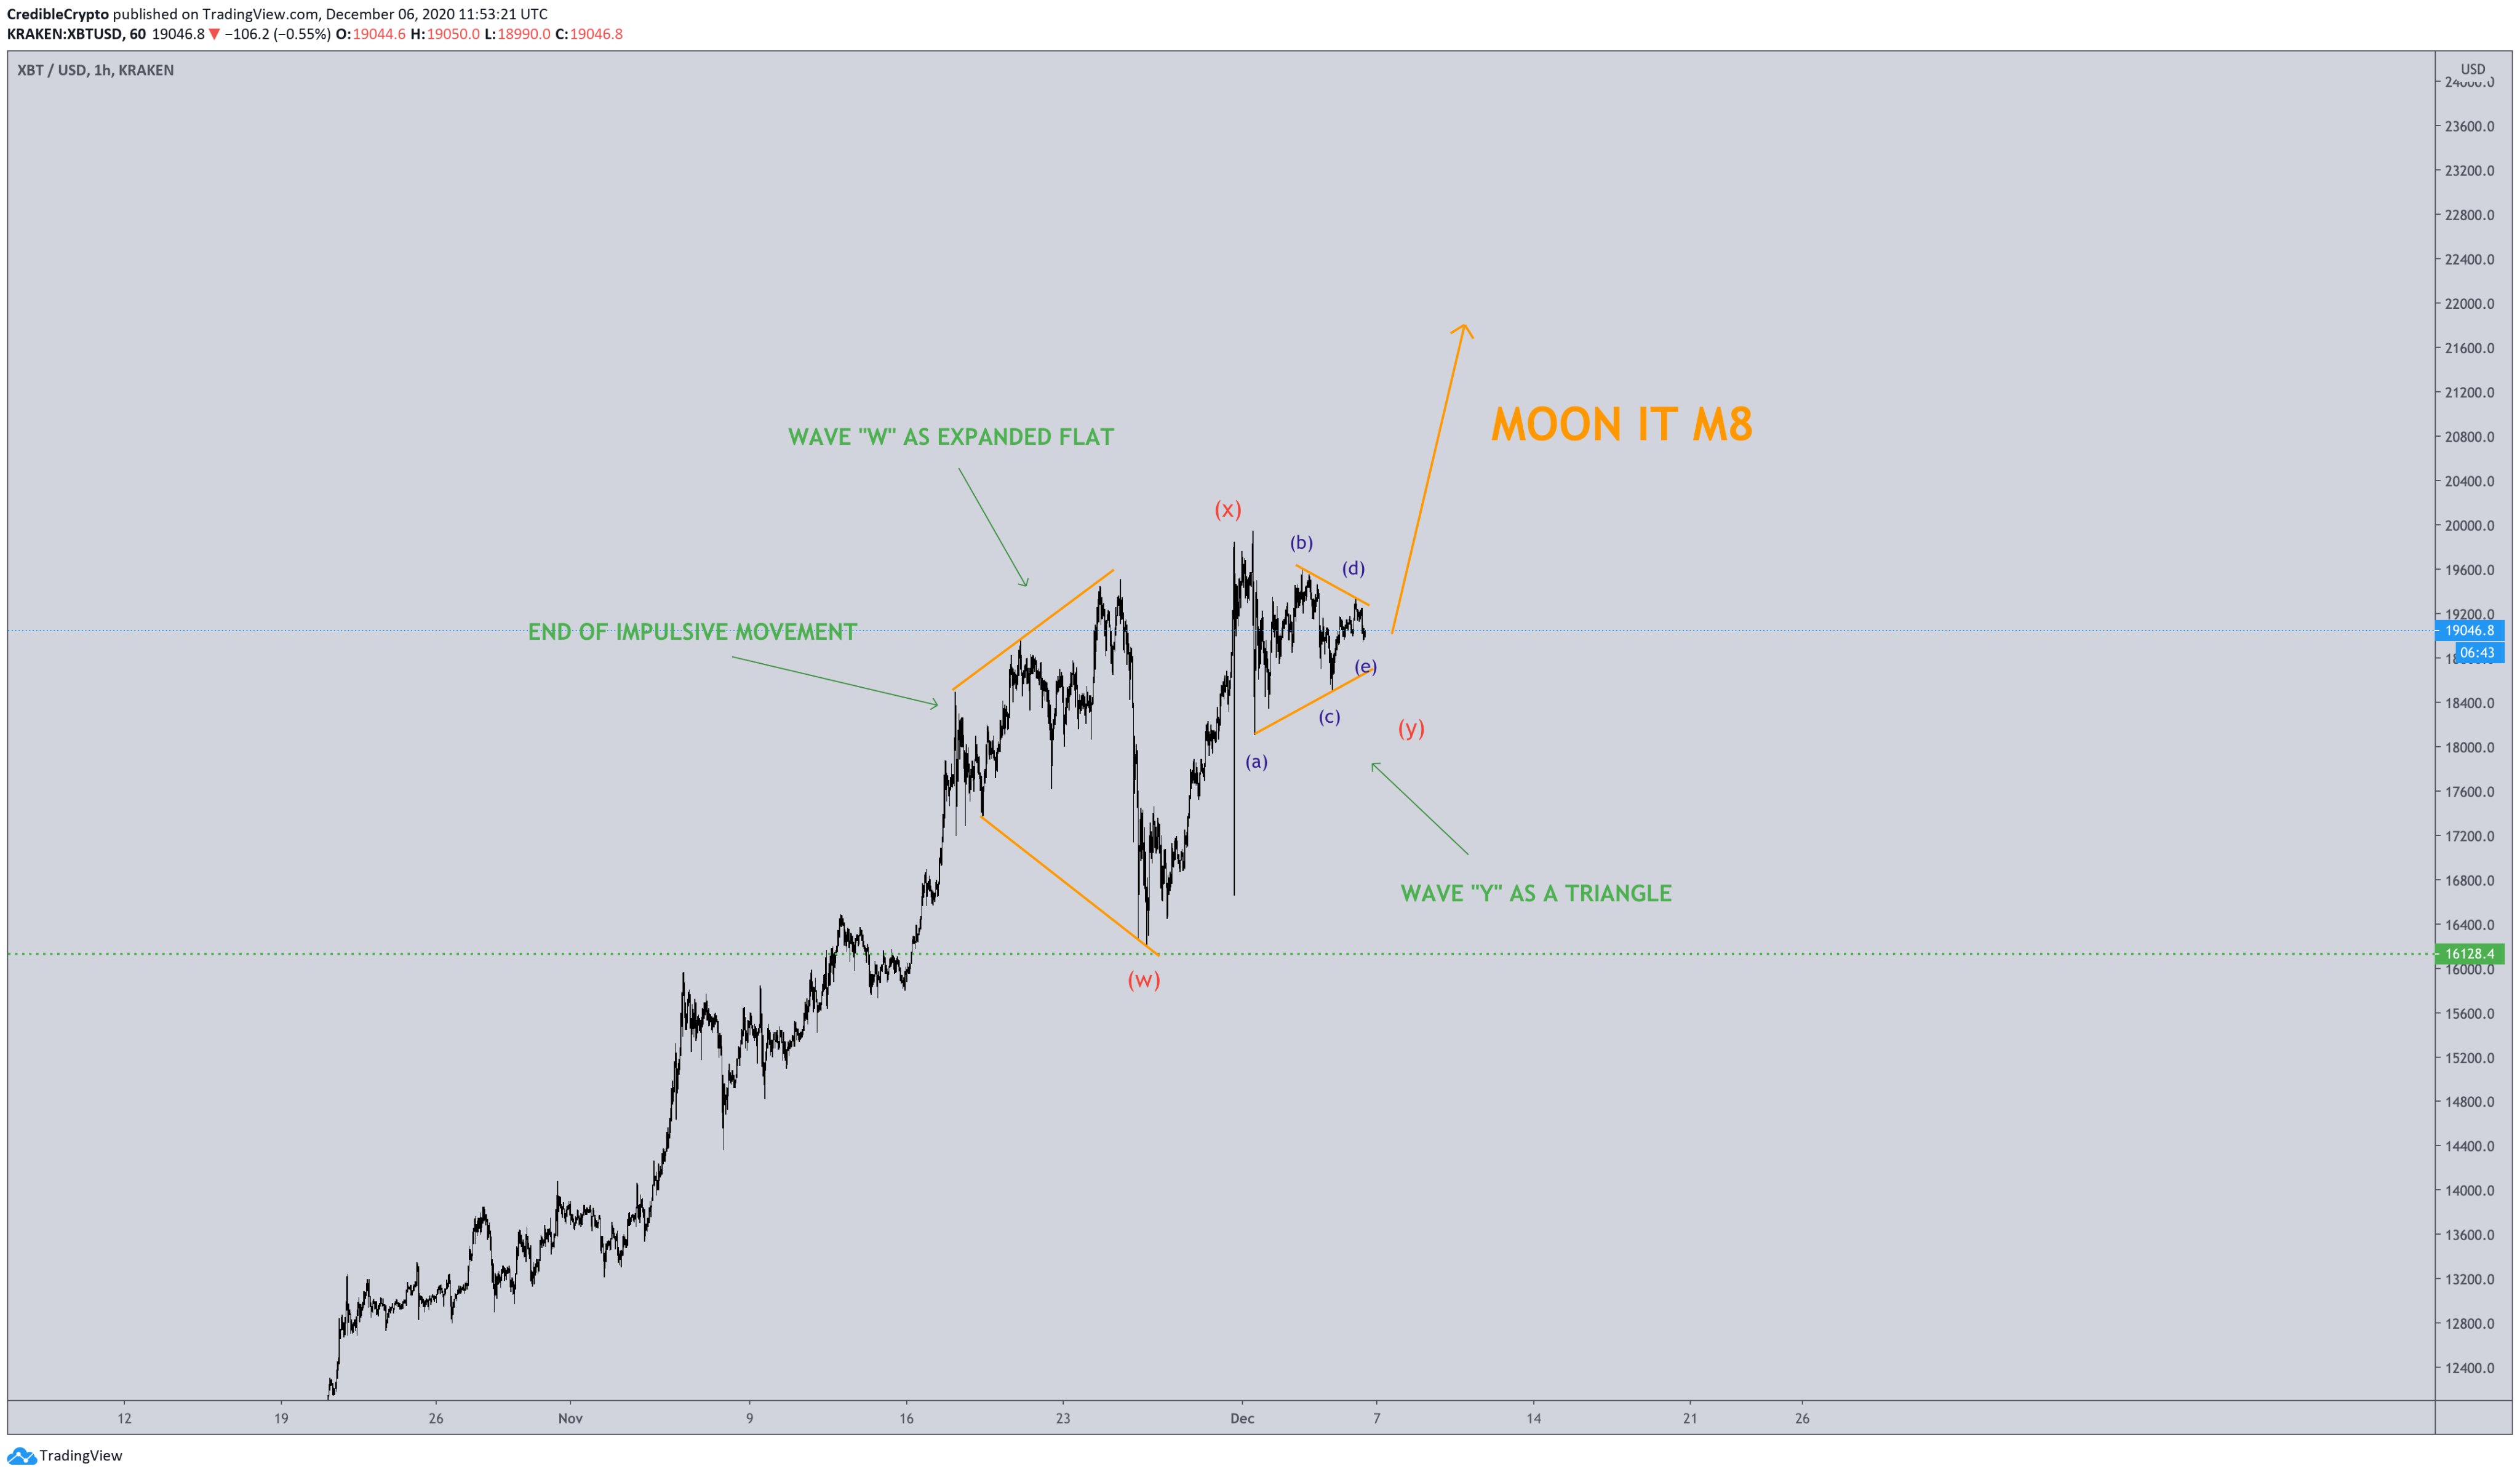
Analyst: Bitcoin Could Soon Break Toward and Above $20,000
Bitcoin has undergone a strong phase of consolidation over the past week. Some fear that this may be a precursor to a strong drop, noting how BTC has formed a swing failure pattern at its highs. One analyst says that based on Elliot Wave, Bitcoin could soon move to new all-time highs. дальше »
2020-12-7 05:00 | |
|
|
Ethereum Drops Below Crucial Technical Pattern and Must Hold $430
Ethereum could undergo a stronger drop in the days ahead, analysts say, as the cryptocurrency slides below key support levels. Ethereum Loses Key Support Level on a Short-Term Basis: Analysis A crypto-asset analyst shared the chart below just recently, showing how the coin has moved below a rising wedge pattern. дальше »
2020-11-16 02:18 | |
|
|
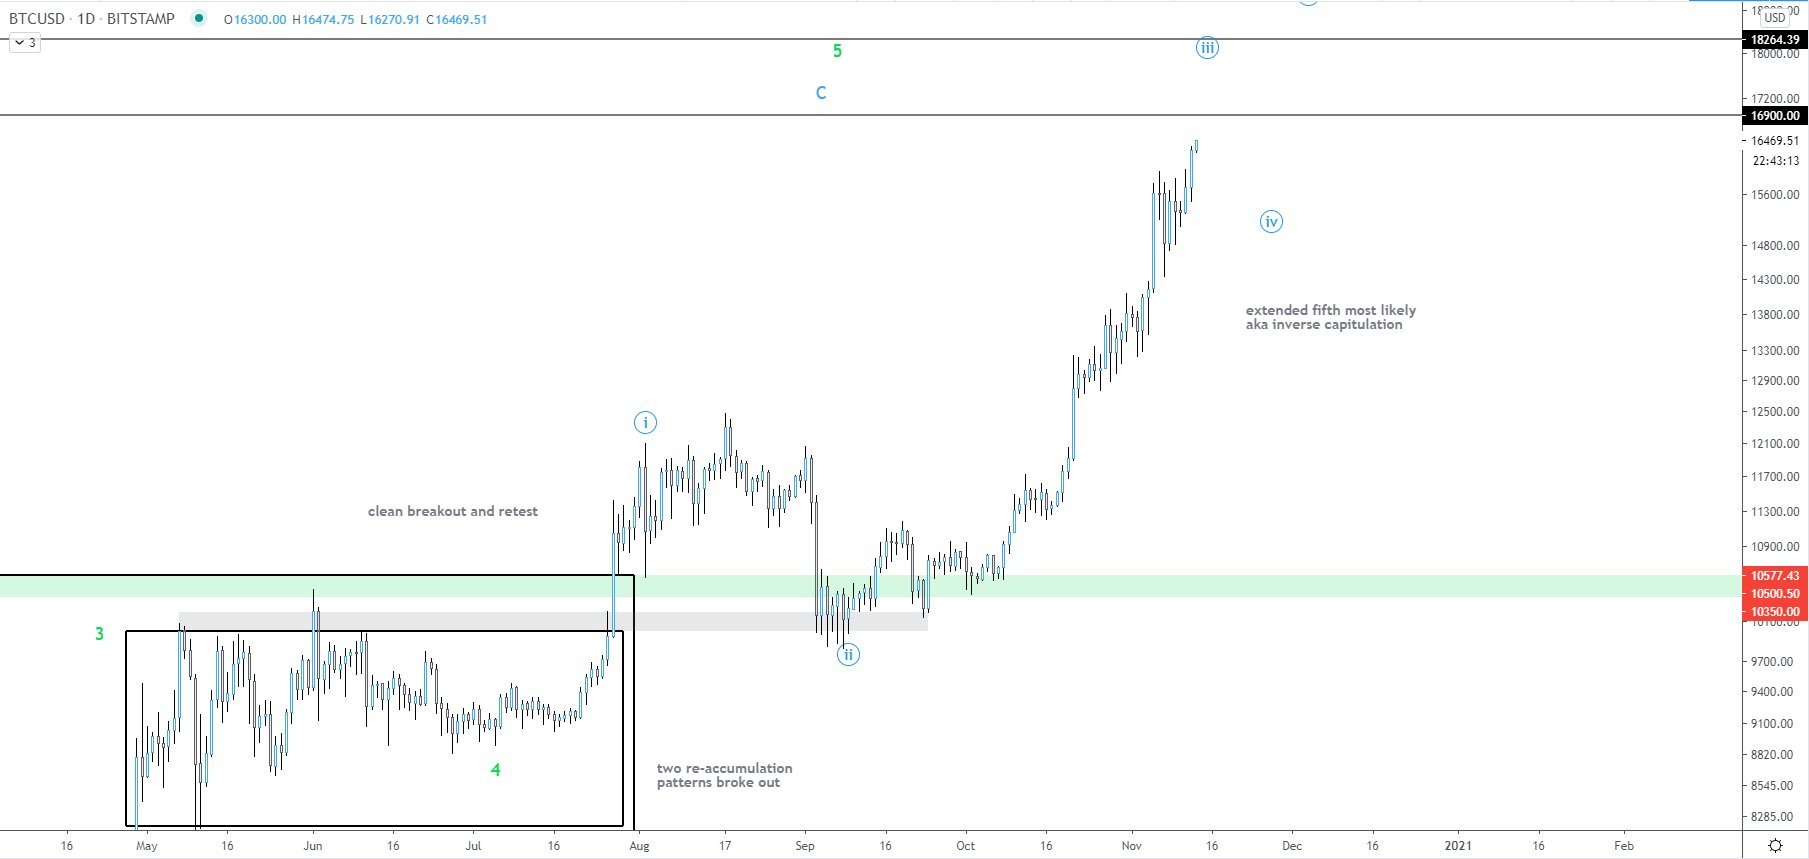
Historically Accurate Analyst Expects Bitcoin to Hit $18,000 In Coming Days
Bitcoin has been rallying higher once again after days of consolidation. The cryptocurrency currently trades for $16,100, though traded as high as $16,500 hours ago. A leading analyst says that Bitcoin is trading in the midst of a textbook Elliot Wave pattern that will likely end with BTC peaking at $18,200 in the coming days, then correct toward $15,000. дальше »
2020-11-14 10:00 | |
|
|

This trend pattern will send Chainlink to never-before-seen highs
Technical analyst Kevin Svenson is of the opinion that Chainlink is all set and in a position to sustain a new all-time high once it is able to attain a certain price region. Chainlink is still one of the new and most promising DeFi tokens around. дальше »
2020-11-9 23:28 | |
|
|
Ethereum at Risk of Major Downside After Failing to Complete Key Pattern
It has been a rough past few days for Ethereum, with Bitcoin’s recent $13,800 rejection sending it plunging below $400 It has not been able to gain any strong momentum in the time since, and analysts do believe that this could indicate that further weakness is imminent ETH’s lackluster price action and severe underperformance has been one of the main reasons why other altcoins have been heavily underperforming BTC One analyst is now noting that […] дальше »
2020-10-31 23:00 | |
|
|

75% Chance Bitcoin Breaks Bullish Towards $12K, Analyst Asserts
There is a 75 percent possibility that Bitcoin breaks bullish out of its ongoing consolidation pattern. According to independent analyst Vince Prince, the benchmark cryptocurrency is making “marginal” upside movements in an Ascending Channel structure. дальше »
2020-10-19 10:59 | |
|
|
A “Cypher Pattern” Sets UNI For 100% Rally, Says Analyst
Associating with the term “DeFi” worked in favor of many blockchain assets this year. UNI was one of them. The governance token, which landed in the hands of people who contributed to the progress and running of UniSwap, a decentralized crypto exchange, was a hit right after its launch. It topped charts after rising more […] дальше »
2020-10-13 16:00 | |
|
|
Troubles for Bitcoin Grow as Analyst Spots “Potential Death Cross”
Bitcoin is on the verge of painting a Death Cross. The technical chart pattern–which forms after an asset’s short-term moving average closes below its long-term moving average–holds credibility for predicting bearish markets. дальше »
2020-10-7 11:01 | |
|
|

Bitcoin is Eerily Copying Gold Trends; Analyst Fears Breakdown
Bitcoin is laggingly tailing the gold chart trends, and it may face trouble for its delayed correlation. That is due to the precious metal’s latest breakdown move, wherein the price broke out of a Symmetrical Triangle pattern to the downside. дальше »
2020-9-23 11:08 | |
|
|

This Grim Technical Pattern Suggests Ethereum May Plunge to $240
Ethereum has seen a strong rebound from its recent lows, which has allowed it to outperform Bitcoin and most other digital assets throughout the past day This rebound has led it from lows of $320 to highs of over $380 Bulls are now vying to push the crypto back into the $400 region, which could allow it to reclaim its bullish market structure and see further upside One analyst doesn’t believe this is going to […] дальше »
2020-9-11 23:00 | |
|
|

Bitcoin Analyst Who Accurately Foresaw Feb Crash Says $9.8K is Next
Bitcoin is going to fall to $9,800, according to a pseudonymous analyst. The prominent daytrader cited the formation of a Head and Shoulder pattern behind his bearish analogy. In retrospect, H&S is a technical pattern described by three peaks. дальше »
2020-9-3 10:25 | |
|
|

Bitcoin Analyst Makes A Serious Bearish Call: A Drop Below $10.2K
An ongoing correction in the Bitcoin market may lead the cryptocurrency lower below $10,500, according to Alexander Nikitin. The founder of MPS Trade, an independent trading consultancy portal, spotted BTC/USD in a Head & Shoulder breakdown pattern. дальше »
2020-8-26 11:08 | |
|
|

Bitcoin’s Cloud Pattern Shows Bears May Still Be in Full Control
Bitcoin and the entire cryptocurrency market are currently bearing witness to relatively mixed price action While BTC has faced some intense selling pressure, it is important to note that bears have not invalidated any of its mid-term market structures As such, it remains well-positioned to see further near-term upside Despite this, one analyst is noting that the cryptocurrency’s cloud formation may spell some trouble for its near-term outlook, as it shows that it is still […] дальше »
2020-8-21 02:00 | |
|
|
Bitcoin Could Hit $12K on Ethereum-Tailing Behaviour: Analyst
Bitcoin is eyeing a breakout towards $12,000, according to crypto-chart analyst Josh Rager. The analogy appears out of Ethereum’s latest upside move from a consolidation range. Mr. Rager sees Bitcoin repeating the same bullish action as it trades inside a similar sideways pattern. дальше »
2020-7-31 14:05 | |
|
|
Bitcoin is Going to Hit $13,500 This Quarter; Analyst Explains Why
Bitcoin may continue its current bull run to hit $13,500 this quarter, according to a technical setup presented by analyst Vince Prince. The TradingView contributor showed the cryptocurrency inside a rising bull flag – an ascending channel pattern, stating it has the strength to break above it. дальше »
2020-7-31 12:09 | |
|
|