2024-3-8 11:30 |
Just below the all-time high of $69,000, the Bitcoin price has shown more volatility in recent days, only to now tread water around $67,000. But this boredom could soon be over. Following the recent price movements, a notable pattern has emerged on the Bitcoin (BTC) price chart, as recognized by the seasoned crypto analyst Josh Olszewicz.
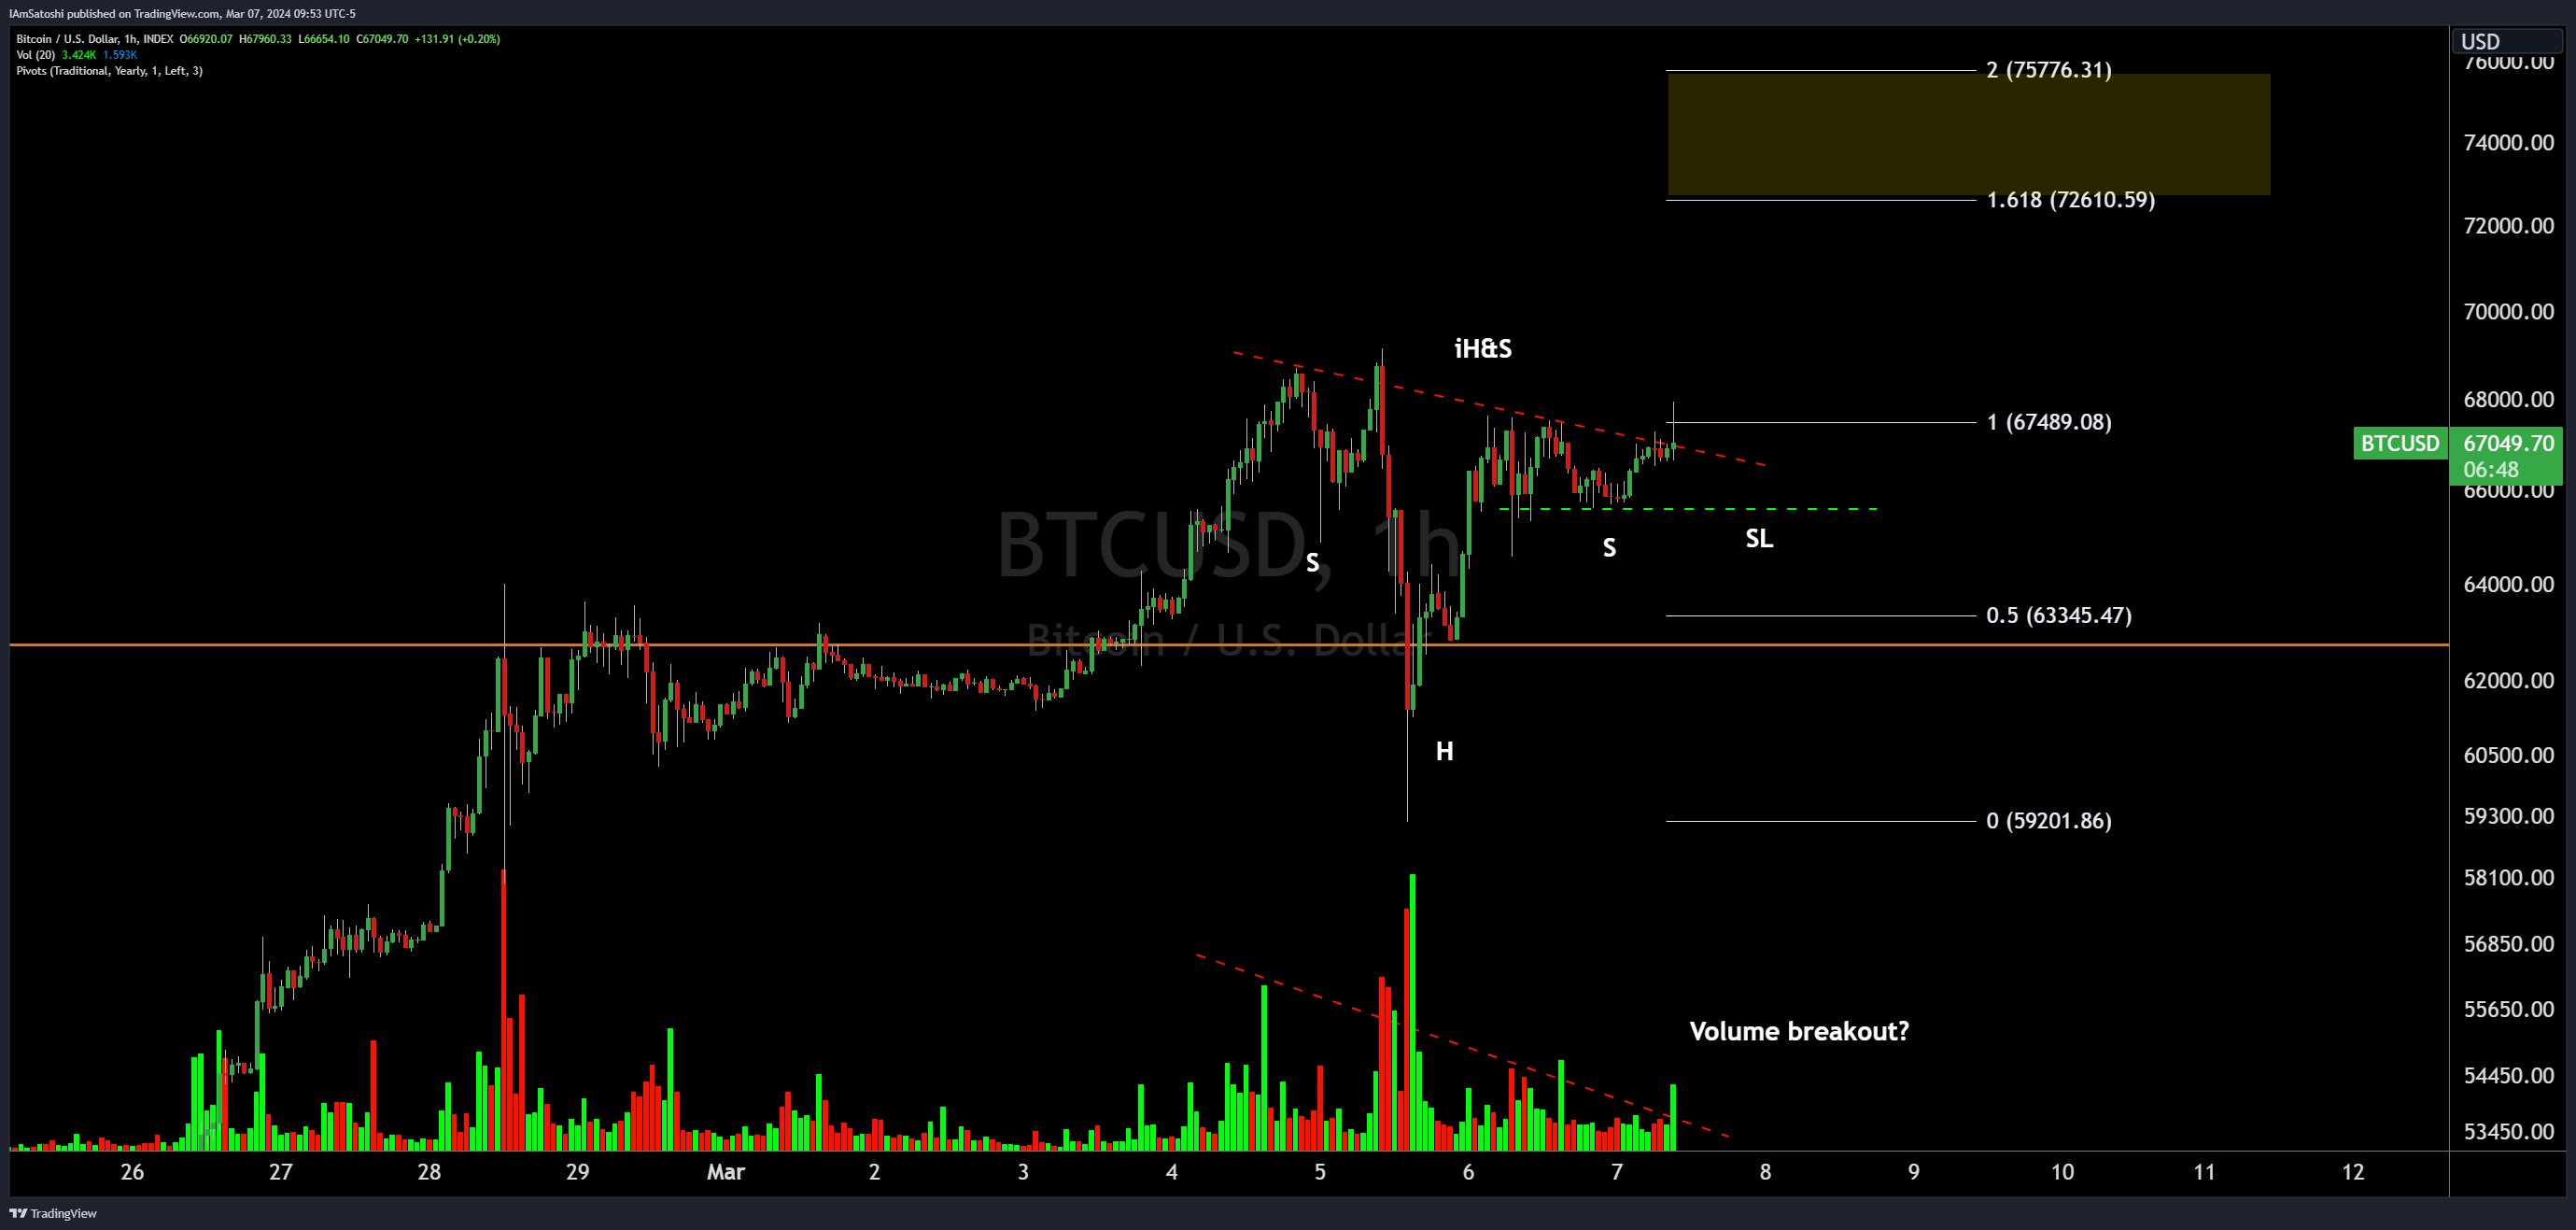
Bitcoin Price Rallye To $76,000 Next?An inverse head and shoulders (iH&S) pattern, often seen as a bullish indicator, has formed on the Bitcoin 1-hour chart, suggesting a potential upward price movement. This pattern, while admittedly imperfect as per Olszewicz, is considered tradeable in his view. “[The] pattern is definitely not perfect but still tradeable imo,” he remarked.
An Inverse Head and Shoulders (iH&S) pattern is a bullish reversal pattern in technical analysis, signaling a potential upward reversal in price trends. It consists of three troughs with the middle trough being the lowest, resembling the shape of a head and two shoulders, but flipped upside down.
In this scenario, Bitcoin’s chart shows the formation with a head at approximately $59,000 and shoulders forming around the $65,000 and $65,700 mark. The pattern suggests that a bullish move is brewing. Traders often use iH&S patterns to identify potential buying opportunities, with entry points typically near the neckline breakout.
The analyst’s chart points to a neckline (dotted red line) slanting downward, intersecting with the right shoulder in the coming days. A breakout above this line is typically required to confirm the pattern. At the current price, Bitcoin is trading just below the neckline.
For traders eyeing potential targets, Olszewicz’s analysis projects an ambitious goal of $73,000 to $76,000, aligned with the Fibonacci extension levels of 1.618 ($72,610.59) and 2 ($75,776.31). These levels represent significant price points that Bitcoin might test if the pattern is confirmed with a solid breakout.
One element that could fortify the potential upward journey is a volume breakout, which the analyst has hinted at with a question mark. The volume indicator on the chart shows an increasing trend, but a decisive surge in volume is typically sought after to confirm an iH&S pattern.
Moreover, Olszewicz has marked a potential stop loss (SL) level with a dashed green line. This level around $65,680 serves as a risk management tool for traders should the pattern fail to realize the upward breakout.
At press time, BTC traded at $67,124.
origin »Bitcoin price in Telegram @btc_price_every_hour
ETH/LINK Price Action Candlestick Set (LINKETHPA) на Currencies.ru
|
|