Новости о Pattern 500 [ Фото новости ] [ Свежие новости ] | |

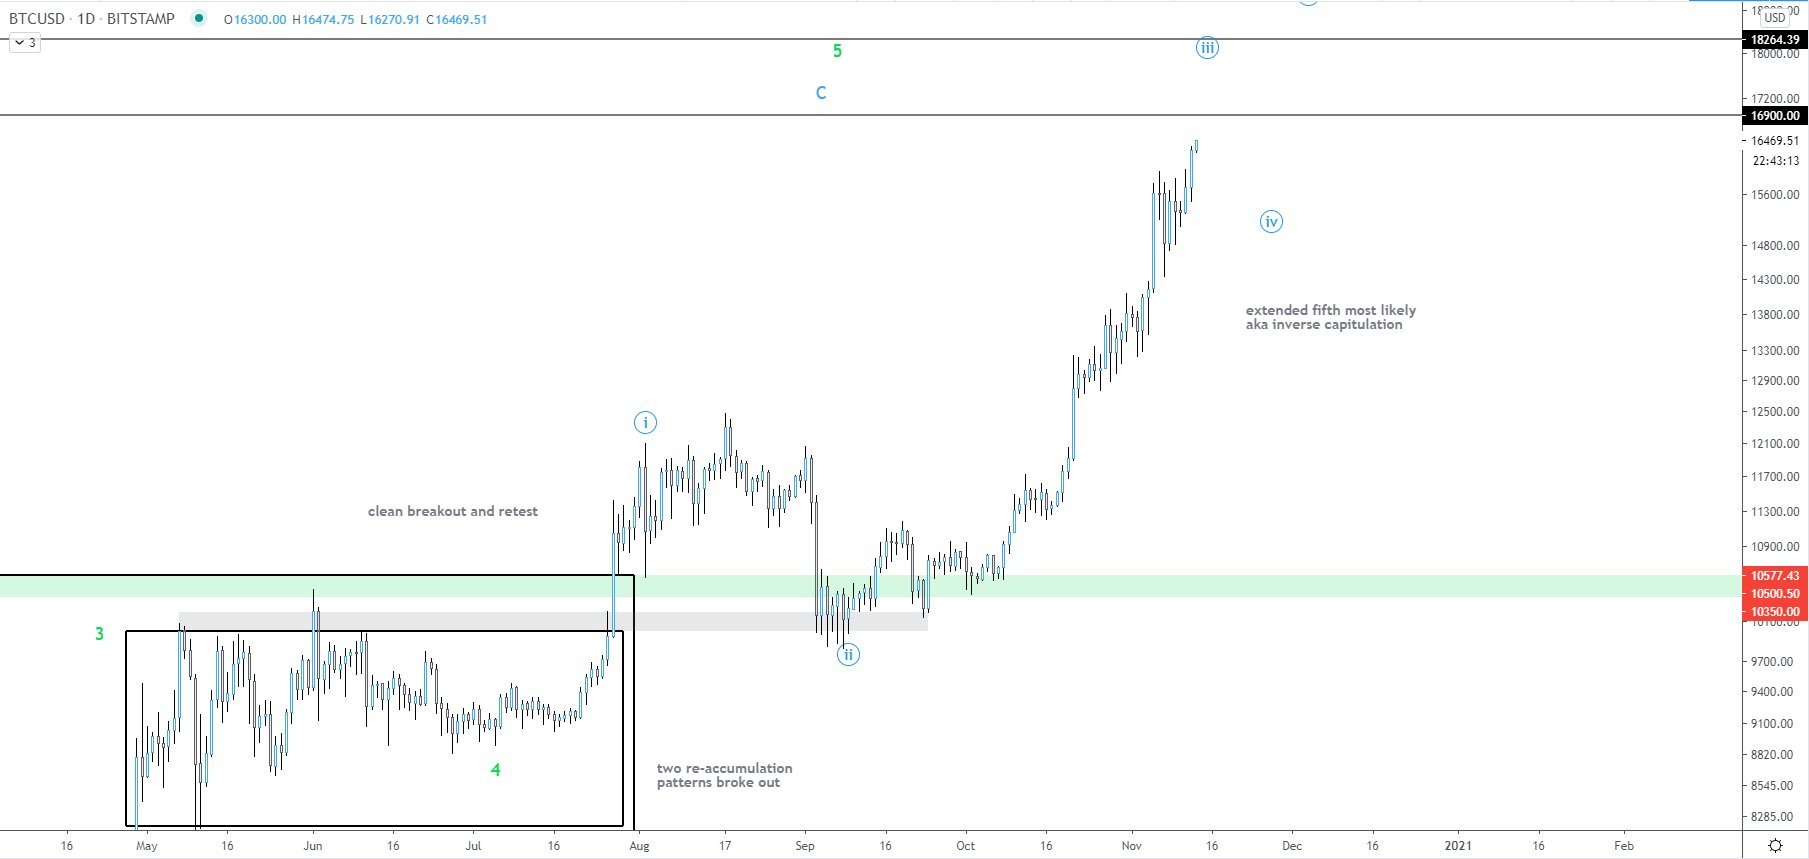
Historically Accurate Analyst Expects Bitcoin to Hit $18,000 In Coming Days
Bitcoin has been rallying higher once again after days of consolidation. The cryptocurrency currently trades for $16,100, though traded as high as $16,500 hours ago. A leading analyst says that Bitcoin is trading in the midst of a textbook Elliot Wave pattern that will likely end with BTC peaking at $18,200 in the coming days, then correct toward $15,000. дальше »
2020-11-14 10:00 | |
|
|
TA: Bitcoin Prints Bullish Pattern, Why Break Above $16K Could Be Significant
Bitcoin price regained momentum and broke the $15,800 resistance against the US Dollar. BTC is trading nicely above the $15,500 support and the bulls seem to be aiming a break above $16,000. Bitcoin gained over 2% and it spiked above the $15,850 resistance zone. дальше »
2020-11-12 06:48 | |
|
|

This Historically Accurate Fractal Suggests Bitcoin Will Soon Hit $15,500
Bitcoin is currently seeing a strong upswing that has led it past multiple heavy resistance levels This move comes just days after tech giant Square announced their plan to hold $50 million worth of Bitcoin as a reserve asset This is the second public company to turn towards BTC to protect their capital, with this bourgeoning trend sparking excitement amongst investors There is one fractal pattern that indicates further upside could be imminent in the […] дальше »
2020-10-11 01:00 | |
|
|

This Grim Pattern Indicates Bitcoin Is Ready to Plunge Towards $9,500
There’s an air of uncertainty within the crypto market, with most altcoins plunging lower as Bitcoin continues consolidating Analysts seem to be unsure of where the benchmark cryptocurrency will trend in the near-term, as it has yet to make any decisive movements One trader is noting that BTC is currently in the process of undergoing a bearish technical cross between two of its moving averages He notes that this could open the gates for a […] дальше »
2020-10-6 21:00 | |
|
|

This Pattern Suggests Bitcoin May Soon Reel Lower and Tap Fresh Lows
Bitcoin is currently caught within an incredibly tight bout of sideways trading, with its price mainly hovering around $10,500 for the past couple of days Overnight, bears did attempt to spark a sharp downside move when they pushed the crypto as low as $10,400 This dip was fleeting, as bulls quickly propelled it back up to its current price level BTC’s inability to form a decisive trend comes as it trades between two crucial levels […] дальше »
2020-9-24 21:00 | |
|
|
Polkadot, Stellar Lumens, VeChain Price Analysis: 15 September
Bitcoin's surge past $10,500 could have a positive effect on the rest of the market as the fear in the markets slowly evaporates. Polkadot confirmed a bullish pattern as it broke upward past the resisThe post Polkadot, Stellar Lumens, VeChain Price Analysis: 15 September appeared first on AMBCrypto. дальше »
2020-9-15 21:00 | |
|
|
Bitcoin Closing Above $10,500 Could Confirm This Bullish Recovery Pattern
Bitcoin remains in a weak spot despite bouncing slightly from the $9,800 lows seen on the weekend. The leading cryptocurrency currently trades for $10,100 as of this article’s writing, down marginally in the past 24 hours. дальше »
2020-9-9 04:00 | |
|
|
Bitcoin Could Recover Above $10,500 As Double Bottom Pattern Emerges
Bitcoin price retested the $9,900 zone against the US Dollar. BTC seems to be forming a double bottom pattern near $9,900 and it could start a decent increase above $10,500. Bitcoin bounced back above $10,200 after it retested the $10,000 and $9,900 levels. дальше »
2020-9-8 07:08 | |
|
|
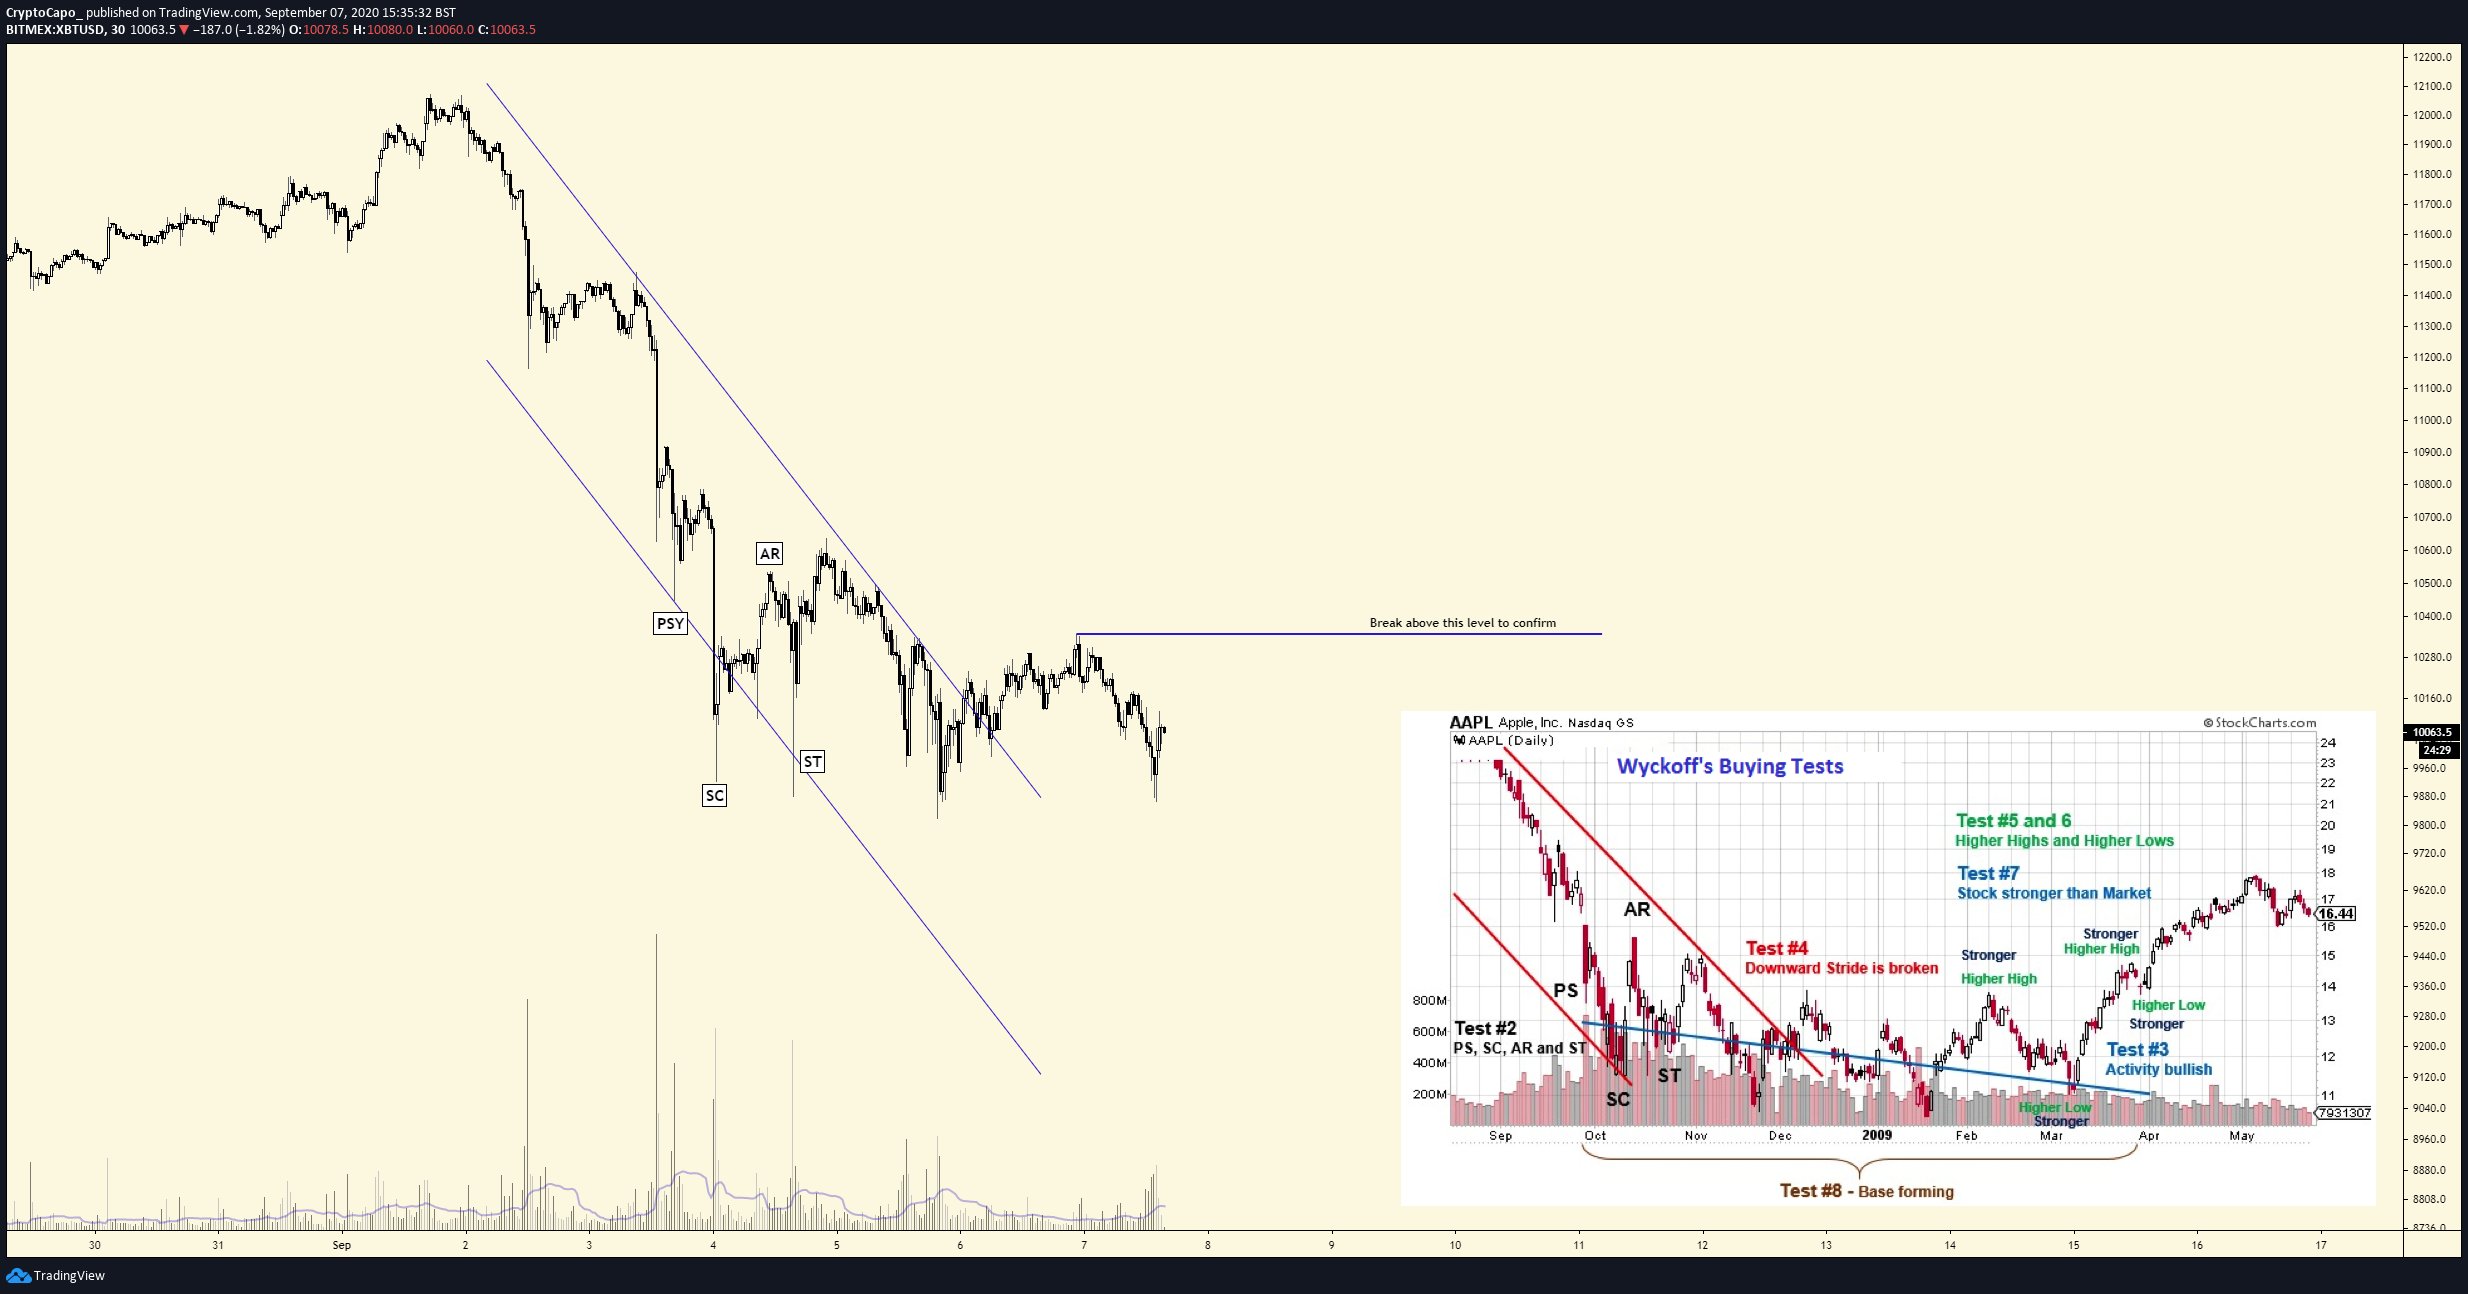
Bitcoin At Potential Risk of Breakdown Below $10,000: Here’s Why
Bitcoin price traded to a new monthly low at $9,853 before correcting higher against the US Dollar. BTC is still following a bearish pattern and it is likely to accelerate lower below $10,000. Bitcoin is trading in a bearish zone below the $10,800 and $10,500 support levels. дальше »
2020-9-7 07:08 | |
|
|
Bitcoin Is Printing a Textbook Bearish Reversal Pattern: $9,000s in Play
Bitcoin’s recent rally has seemingly been bullish, bringing the asset above $10,500, then $11,500. As of this article’s writing, the cryptocurrency trades for $11,500. BTC may actually be trading in a textbook top pattern, though. дальше »
2020-8-30 02:00 | |
|
|

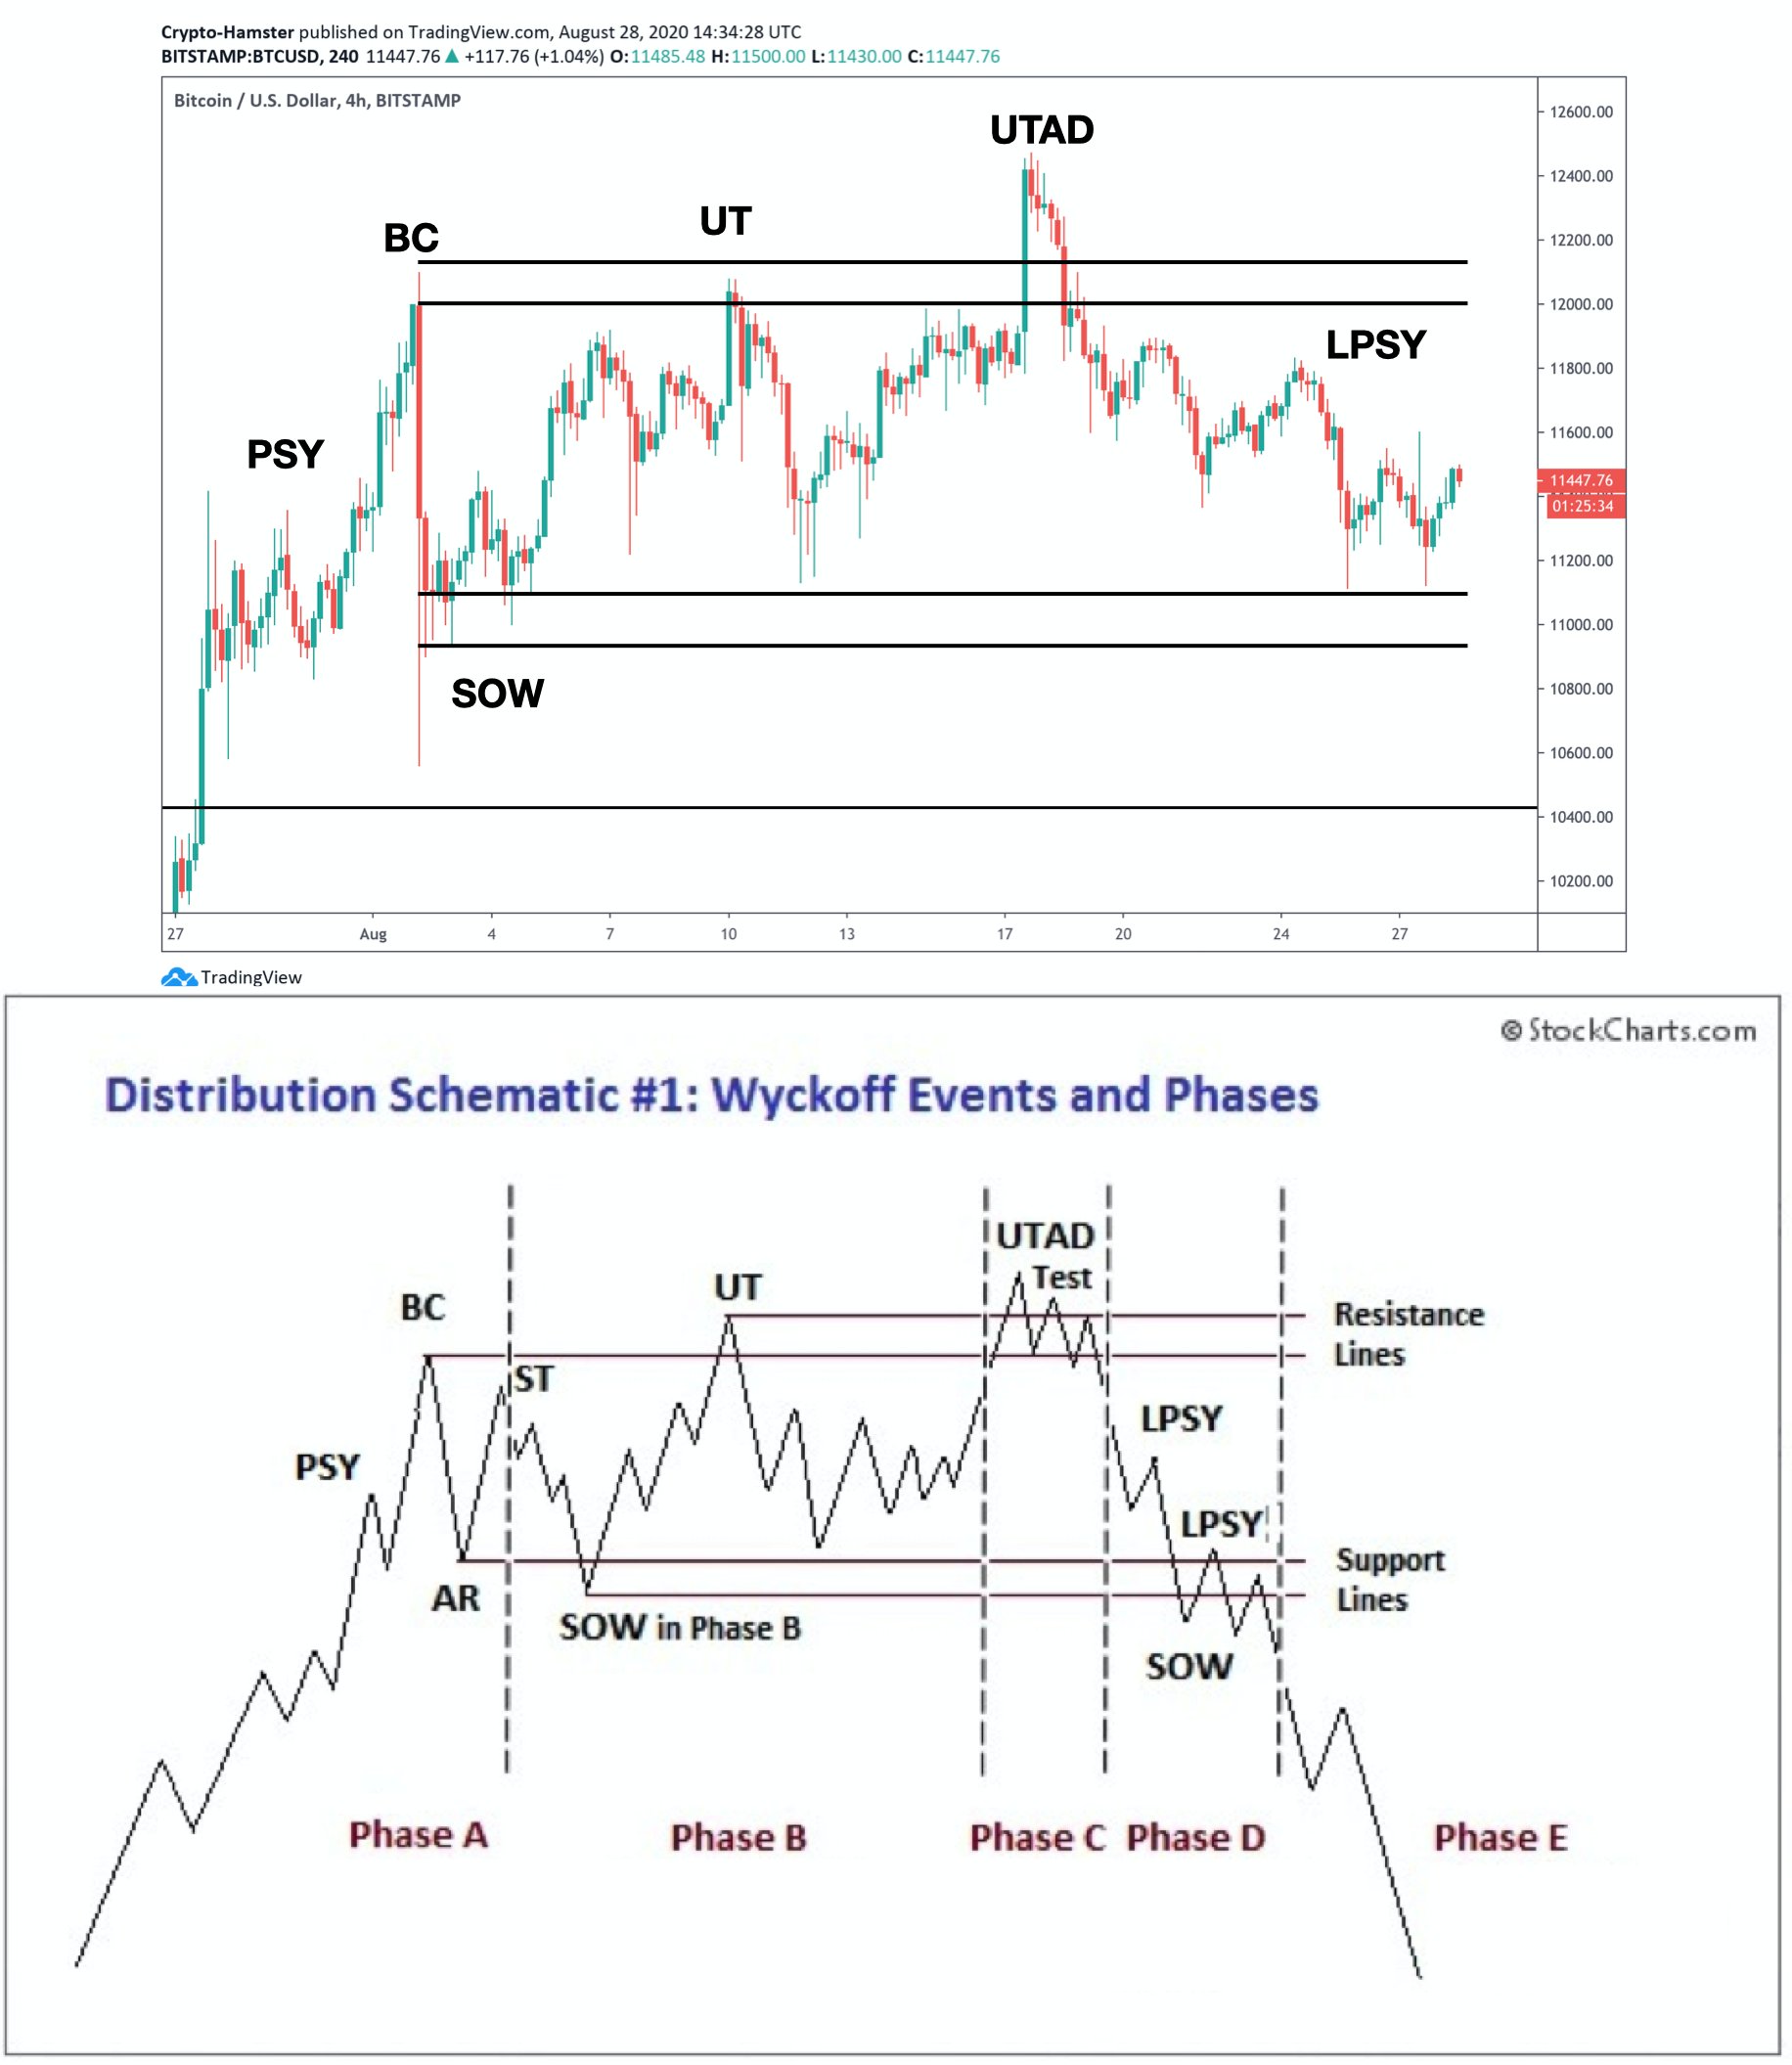
Current Bitcoin Price Action Closely Follows Textbook Distribution Pattern
Bitcoin bulls are currently attempting to turn weekly resistance at $11,500 into support. However, failure may be likely according to an ominous pattern the cryptocurrency is painting. Recent price action in the first-ever cryptocurrency closely mimics that of a Wyckoff distribution model. дальше »
2020-8-30 22:00 | |
|
|
Bitcoin Could Rally Above $11,500 As Double Bottom Pattern Emerges
Bitcoin price is forming a strong support and a possible double bottom near $11,140 against the US Dollar. BTC is likely to rally if it clears the $11,500 resistance. Bitcoin is showing a few positive signs above the $11,140 and $11,200 support levels. дальше »
2020-8-28 07:08 | |
|
|

Bitcoin Analyst Makes A Serious Bearish Call: A Drop Below $10.2K
An ongoing correction in the Bitcoin market may lead the cryptocurrency lower below $10,500, according to Alexander Nikitin. The founder of MPS Trade, an independent trading consultancy portal, spotted BTC/USD in a Head & Shoulder breakdown pattern. дальше »
2020-8-26 11:08 | |
|
|
This Bullish Continuation Pattern Suggests Bitcoin Could Rally Above $12,500
Bitcoin price gained nearly 5% and it tested the $12,500 resistance against the US Dollar. BTC is currently correcting gains, but technicals suggest more upsides above $12,500. Bitcoin broke the main $12,000 resistance area to start a strong upward move. дальше »
2020-8-18 07:08 | |
|
|
Despite $500 “Bart” Pattern, Analysts Are Still Bullish on Bitcoin
Bitcoin surged past $12,000 on Monday morning, rallying as certain altcoins plunged. The move brought the cryptocurrency as high as $12,100. Just as fast as BTC rallied, though, it dropped. Just hours after $12,000 was tapped, Bitcoin plunged around $500 in the span of an hour, forming a “Bart” formation. дальше »
2020-8-11 15:00 | |
|
|
Bitcoin is Going to Hit $13,500 This Quarter; Analyst Explains Why
Bitcoin may continue its current bull run to hit $13,500 this quarter, according to a technical setup presented by analyst Vince Prince. The TradingView contributor showed the cryptocurrency inside a rising bull flag – an ascending channel pattern, stating it has the strength to break above it. дальше »
2020-7-31 12:09 | |
|
|

S&P 500 Just Printed a Textbook Bull Signal: Here’s Why Bitcoin Can Benefit
Bitcoin is trading up 0. 2% while the S&P 500’s futures are trading down 0. 4%, as of this article’s writing. Despite the slight drop, the index remains in a textbook bull pattern primed to end in a strong upwards breakout. дальше »
2020-7-20 13:00 | |
|
|

This Bullish Continuation Pattern Suggests Bitcoin Is Gearing For Another Lift-Off
Bitcoin climbed higher above $9,500, but it struggled to clear $9,600 against the US Dollar. BTC is now correcting gains and it seems like there is a bullish flag forming with resistance at $9,450. дальше »
2020-6-18 06:58 | |
|
|

Here are the Simple Reasons Why Bitcoin May Soon Explode Past $10,500
After a brief break below $9,000 earlier this week, Bitcoin has been able to post a strong rebound from these lows, now navigating back up towards $9,600 This climb seen throughout yesterday is certainly positive for bulls, as it points to underlying strength amongst BTC’s buyers Analysts are now laying out a few simple reasons for why this recent price action could mark an accumulation pattern If this pattern plays out, then BTC is bound […] дальше »
2020-6-17 21:00 | |
|
|

Bitcoin Gets Rejected Once More by $10,500 Resistance
On June 1, the Bitcoin (BTC) price broke out from a pattern that had been in place for nearly one month and proceeded to reach a high of $10,380. While this is a very bullish development, the price has yet to move above a crucial resistance area that will likely determine the direction of the […] The post Bitcoin Gets Rejected Once More by $10,500 Resistance appeared first on BeInCrypto. дальше »
2020-6-3 19:58 | |
|
|
Restored Falling Wedge Pattern Sees Bitcoin Rising above $11,500
It appears Bitcoin missed a medium-term upside target above $11,500 after undergoing a significant sell-off in March 2020. The major northward move had appeared out of a Falling Wedge breakout. Bitcoin reentered the Wedge after the crash and followed it with a breakout towards a new bull target near $9,500. The cryptocurrency is still eyeing... дальше »
2020-6-1 16:00 | |
|
|
This Eerily Accurate Fractal Predicts Bitcoin Will Rocket to $20,000 in 2020
While Bitcoin is up 5% over the past two days, the crypto-asset market remains in consolidation. After hitting $10,100 in late April, the cryptocurrency has stagnated under that key level. It has since traded in a relatively tight consolidation pattern from $8,500 to $9,500, failing to move decisively out of this range. Though a popular... дальше »
2020-5-30 03:00 | |
|
|
Bitcoin Prepares to Rally to $12,000 as Price Forms Historically Bullish Pattern
After attempting to break decisively past $10,000 for the second time in a week, Bitcoin was rejected, plunging as low as $9,200 for the umpteenth time in a matter of days. The tepid price action has made some investors cautious that more downside for the flagship cryptocurrency is possible, citing the loss of the key $9,500... дальше »
2020-5-17 10:08 | |
|
|
Bitcoin’s boom against altcoins proves the rally to $9,000 is legitimate
Bitcoin and cryptocurrencies have experienced a massive surge over the past 10 days. After trading in the $7,000s for weeks on end, BTC finally saw a breakout to $9,500 just last week, since settling into a consolidation pattern a few percentage points shy of the high. дальше »
2020-5-7 13:00 | |
|
|
Bitcoin Forming Another Bullish Breakout Pattern and It Could Rally To $7.2K
Bitcoin is up more than 4% and it broke the key $6,500 resistance area against the US Dollar. BTC price is forming a solid bullish trend and it could soon rally towards $7,000 or $7,200. Bitcoin started a fresh increase after testing the $6,200 support area against the US Dollar. The price is up close... дальше »
2020-4-2 08:28 | |
|
|
Bitcoin Trading Near Make-or-Break Levels: Can Bulls Make It?
Bitcoin is currently correcting higher from the $3,906 swing low against the US Dollar. BTC is now forming a crucial breakout pattern, which is likely to decide the next move. Bitcoin price seems to be facing a lot of hurdles on the upside near $5,500 and $5,950. дальше »
2020-3-15 08:28 | |
|
|

Bitcoin’s 10% Flash Crash May Actually Satisfy This Bullish Chart Pattern
Bitcoin didn’t fare too well on Wednesday. After recovering to $10,300 from the weekend’s low of $9,500 — a gain of just over 8% — the price of the leading cryptocurrency fell off a cliff as the day came to a close on Wednesday. дальше »
2020-2-20 12:11 | |
|
|
Bitcoin to See a Massive Trend-Defining Movement Because of This Simple Pattern
Following yesterday selloff that sent Bitcoin down to lows of $9,500, the cryptocurrency’s buyers have been able to absorb the intense selling pressure and push BTC higher, with it finding some decent stability within the upper-$9,000 region. дальше »
2020-2-19 00:00 | |
|
|
This Technical Pattern Indicates Bitcoin Could Soon Surge Past $11K
Bitcoin price revered losses and climbed to a new 2020 high at $10,406 against the US Dollar. BTC is now eyeing another bullish wave above $10,500 in the near term. Bitcoin is gaining bullish momentum above the $10,000 and $10,200 resistance levels against the US Dollar. дальше »
2020-2-12 08:18 | |
|
|

Link Breaks out Towards Its All-Time High Price
On February 5, the Chainlink (LINK) price broke out from an inverse head and shoulders (H&S) pattern and has been increasing since. LINK Price Highlights There is support at 31,500 satoshis. There is resistance at 36,000 satoshis. дальше »
2020-2-9 22:16 | |
|
|
The Last Time Bitcoin Showed This Formation, It Dropped to $6,000
The bitcoin price rejected $9,500, a multi-year resistance it has been teasing with throughout the past two weeks. The last time it rejected at this level in a similar pattern, it dropped to the $6,000s. дальше »
2020-2-3 12:02 | |
|
|
Bitcoin Bulls Alert: This Head & Shoulders Pattern Could Trigger Violent Drop
Bitcoin traded to a new 2020 high at $9,575 and recently corrected lower against the US Dollar. It seems like a head and shoulder pattern is forming, which could drag BTC towards $8,800. After a steady rise, bitcoin price struggled to gain momentum above $9,500 against the US Dollar. дальше »
2020-2-2 08:28 | |
|
|
This Pattern Suggests Bitcoin is Statistically Likely to Rally Parabolically to New Highs
Yesterday evening Bitcoin (BTC) incurred a massive amount of buying pressure that led its price to rally to fresh 2020 highs of $9,500 before it found some strong resistance that led to a slight retrace towards $9,300. дальше »
2020-1-30 00:00 | |
|
|
This Technical Pattern Suggests Ethereum Is Gearing For Another Lift-Off
Ethereum is trading nicely above the $162 and $158 support levels, similar to bitcoin above $8,500. ETH price is likely forming an inverse head and shoulders pattern, suggesting a fresh increase. Ether price is currently consolidating above the $162 support area against the US Dollar. дальше »
2020-1-21 06:04 | |
|
|
Bitcoin Forming Double Top And It’s Vulnerable Below $8,500
Bitcoin struggled to break the $8,900 resistance on two occasions against the US Dollar. BTC price is showing a few bearish signs and it seems like it could decline towards $8,300 or $8,200. Bitcoin price is likely forming a double top pattern near the $8,900 resistance against the US Dollar. дальше »
2020-1-16 08:28 | |
|
|
Analysis: BSV Is Up 500% Thanks to Wash Trading
Bitcoin Satoshi’s Vision (BSV) entered a massive bull rally which saw the coin’s price increase by 5x. As the crypto community questions the sudden upswing, a technical pattern estimates that BSV is bound for an inevitable correction. дальше »
2020-1-16 18:36 | |
|
|
Bitcoin Rejected at $7,500; A Much Larger Drop Could Be Imminent
Bitcoin has incurred multiple bouts of bullishness over the past several days and weeks, with each rally resulting in a strong rejection that leads the cryptocurrency to fully retrace its gains. This pattern occurred again today, when BTC surged to highs of nearly $7,500 before incurring a strong and swift rejection. дальше »
2019-12-27 04:00 | |
|
|
Bitcoin Rallies 5% To Clear Hurdles, Bulls Aiming $8K
Bitcoin price rallied more than 5% to clear the $7,500 resistance against the US Dollar. The price is now trading in a positive zone and it could rise further above $7,700. There is a short term breakout pattern forming with resistance near $7,590 on the hourly chart of the BTC/USD pair (data feed from Kraken). дальше »
2019-12-23 09:00 | |
|
|
Bitcoin Price Dives $700 as Simpsons Pattern Rears Its Ugly Head
The bitcoin price careened below $11,500 on Wednesday afternoon as a Simpsons-inspired technical formation reared its ugly head - and sapped the momentum out of the crypto market's rally. Bitcoin Price Slides Below $11,500 in Rapid Pullback The dominant cryptocurrency had surged past $12,000 shortly after 9:00 am ET, only to relinquish those gains in […] The post Bitcoin Price Dives $700 as Simpsons Pattern Rears Its Ugly Head appeared first on CCN Markets дальше »
2019-8-8 20:52 | |
|
|

Bitcoin Price Struggling To Stay Above $10,000
Another day has brought another movement in BTC markets and yet again it has been downwards. As bitcoin price battles to stay above $10,000, analysts are looking at new levels of support. Bitcoin Bart Patterns Back Yesterday’s bounce from $9,500 topped out at around $10,180, hitting the 200-hour moving average twice. дальше »
2019-7-26 11:56 | |
|
|
Bitcoin Could See $18,000 Should Breakout Occur, Pattern Suggests
Bitcoin Breakout Could Send it to $13,000… or $18,000 Again, Bitcoin (BTC) volatility has dropped through the floor, with the cryptocurrency finding itself trading within $10,500 to $11,000 for over a day now. дальше »
2019-7-23 18:23 | |
|
|
Dow Swirls in Holding Pattern Ahead of OPEC, G20, & June Data Dump
The Dow and broader U. S. stock market traded in a narrow range on Monday, as investors remained on the sidelines in anticipation of a slew of high-profile events later in the week. Dow Ekes Out Modest Gains; S&P 500 Falls Wall Street's major indexes hovered right around break-even on Monday, which reflected a tepid pre-market for Dow futures. дальше »
2019-6-25 22:08 | |
|
|
Ethereum Price Analysis ETH / USD: Just One Spark To Ignite
Ethereum has a bullish short-term trading bias, with the ETH / USD pair testing towards the current 2019 trading high The four-hour time frame shows that bulls are attempting to invalidate a bearish head and shoulders pattern The daily time frame continues to show a large bullish pattern with an upside target close to $500. дальше »
2019-6-22 16:54 | |
|
|
Ethereum Price Analysis ETH / USD: Crisis Averted, $500 Target
Ethereum has a bullish short-term trading bias, with the ETH / USD pair testing towards key upside resistance The four-hour time frame continues to show a valid bearish head and shoulders pattern The daily time frame shows a large bullish pattern with an upside target close to the $500. дальше »
2019-6-13 16:25 | |
|
|
If Bitcoin Fails to Close Above $8,000, BTC May Plummet Lower During Week Ahead
Bitcoin (BTC) and the aggregated crypto markets have been facing a bout of sideways trading over the past couple of days, oscillating between the mid-$7,500 region and the lower-$8,000 region for the past several days. дальше »
2019-6-8 22:30 | |
|
|
Bitcoin to Hit $400,000 BTC/USD Within the Next 10 Years if Pattern Continues
Despite experiencing instability in the past few days, Bitcoin is maintaining its bullish momentum as it starts June at $8,500 level. The last month tuned out to be the best month in a long time as it registered more than 60 percent gains. дальше »
2019-6-2 20:56 | |
|
|
Bitcoin Price Analysis: Two Bullish Indicators Are Flashing at $8K
Bitcoin price analysis shows that bullish momentum is building as BTC reclaims the psychological $8K level. But is a new YTD-high next? Bitcoin Price Analysis: Daily Chart Bitcoin’s price continues to track nicely inside an ascending triangle pattern, after bulls successfully springboarded off the $7,500 level yesterday. дальше »
2019-5-24 16:00 | |
|
|