2020-10-11 01:00 |
Bitcoin is currently seeing a strong upswing that has led it past multiple heavy resistance levels This move comes just days after tech giant Square announced their plan to hold $50 million worth of Bitcoin as a reserve asset This is the second public company to turn towards BTC to protect their capital, with this bourgeoning trend sparking excitement amongst investors There is one fractal pattern that indicates further upside could be imminent in the near-term BTC has been closely tracking this fractal throughout the past few months, if this trend continues, then it may soon rally as high as $15,500
Bitcoin and the entire cryptocurrency market had previously been caught within the throes of a prolonged consolidation phase.
This was driven by BTC remaining stuck between $10,200 and $11,200. The resistance towards the upper boundary of this range was shattered in a violent push higher seen yesterday afternoon.
The cryptocurrency now appears to be positioned to see significantly further gains in the days and weeks ahead.
One fractal pattern that has Bitcoin’s price has been closely tracking indicates that this recent upswing could mark the start of a larger trend that sends BTC up to highs of $15,500.
Bitcoin Rallies Past $11,400 as Bulls Take the HelmAt the time of writing, Bitcoin is trading up just over 3% at its current price of $11,420.
Over the past month, it has been ranging between $10,200 and $11,200, with the resistance at the upper boundary of this range catalyzing multiple intense selloffs. Because bulls have decisively broken through this region, further upside could be right on the horizon.
The upcoming weekly candle close – taking place tomorrow at 0:00 GMT – will offer serious insight into the long-term significance of this movement.
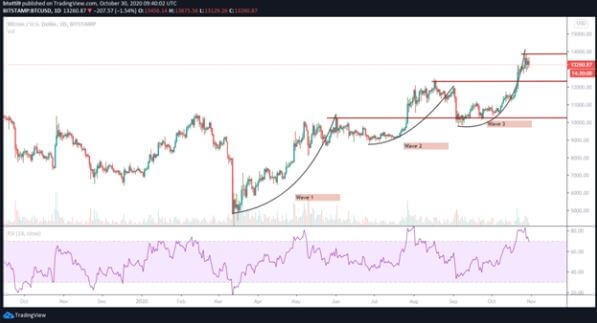
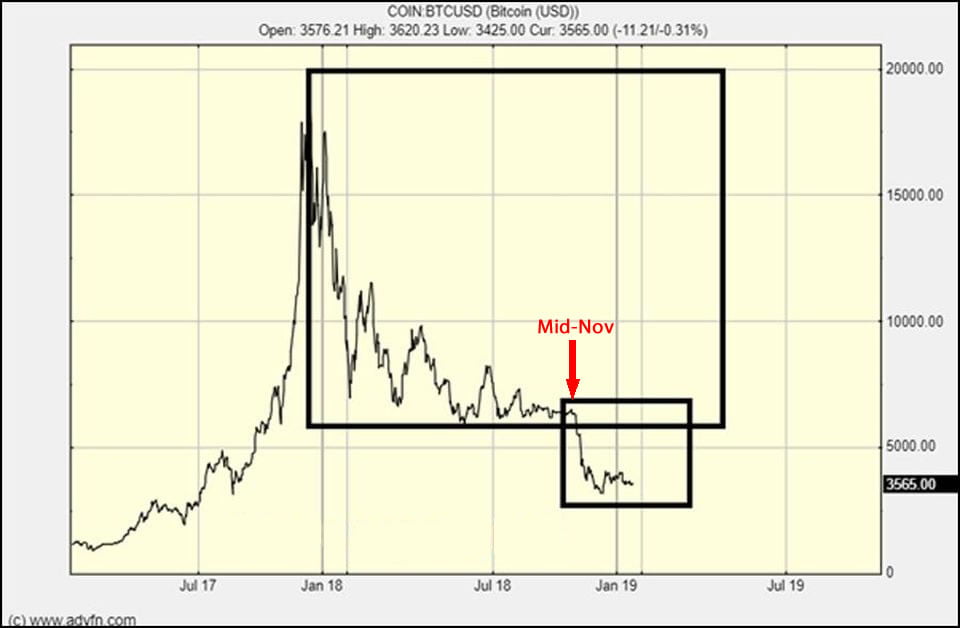
This Fractal Suggest BTC May Soon Rally Towards $15,500One analyst recently pointed to a fractal pattern he created that Bitcoin has been closely tracking throughout the past year.
He notes that this pattern now signals that it is entering a new uptrend that could lead it up towards $15,500 in the coming months.
“Bitcoin: My chart from February 2019 is still perfect down to the candle. Let’s see if it stays that way. Pump the corn.”
Image Courtesy of Kaleo. Chart via TradingView.If the correlation between this fractal and Bitcoin’s price continues playing out, the next few months will be decisively bullish for the benchmark cryptocurrency.
Featured image from Unsplash. Charts from TradingView. origin »Bitcoin price in Telegram @btc_price_every_hour
Bitcoin (BTC) на Currencies.ru
|
|