Новости о Market Direction [ Фото новости ] [ Свежие новости ] | |

Bitcoin Delivery on Bakkt Remains Unaffected by an Unstable Market
The physical delivery of Bitcoin on ICE’s Bakkt is looking to be moving in the opposite direction of price. This month, Bitcoin price went down as low as $3,850 on March 12th however, the physical delivery of Bitcoin had a record increase of 44%. дальше »
2020-3-26 19:13 | |
|
|
Analyst: Ethereum Prepares for Massive 95% Move Against BTC, But Which Direction?
Ethereum started off 2020 as bullish as can be, outperforming BTC and other crypto assets by a large margin. The top altcoin in the crypto market may soon make a massive 95% move against Bitcoin, according to one analyst, but the direction of that move is still up in the air, although they’re leaning heavily... дальше »
2020-3-20 20:00 | |
|
|
Ethereum Options remain indecisive as market lacks clear direction
It's been a rough past week for the collective digital asset market, with Ethereum emerging as one of the worst affected assets in the industry. At press time, Ethereum was valued at $118.51 after The post Ethereum Options remain indecisive as market lacks clear direction appeared first on AMBCrypto. дальше »
2020-3-17 20:30 | |
|
|
Bitcoin Futures volume on CME at $445 million after major dip
Bitcoin Futures on the Chicago Mercantile Exchange [CME] were draining in terms of volume and Open Interest [OI], until recently. However, as the market changed its direction and began to slump on 9 MThe post Bitcoin Futures volume on CME at $445 million after major dip appeared first on AMBCrypto. дальше »
2020-3-11 00:30 | |
|
|
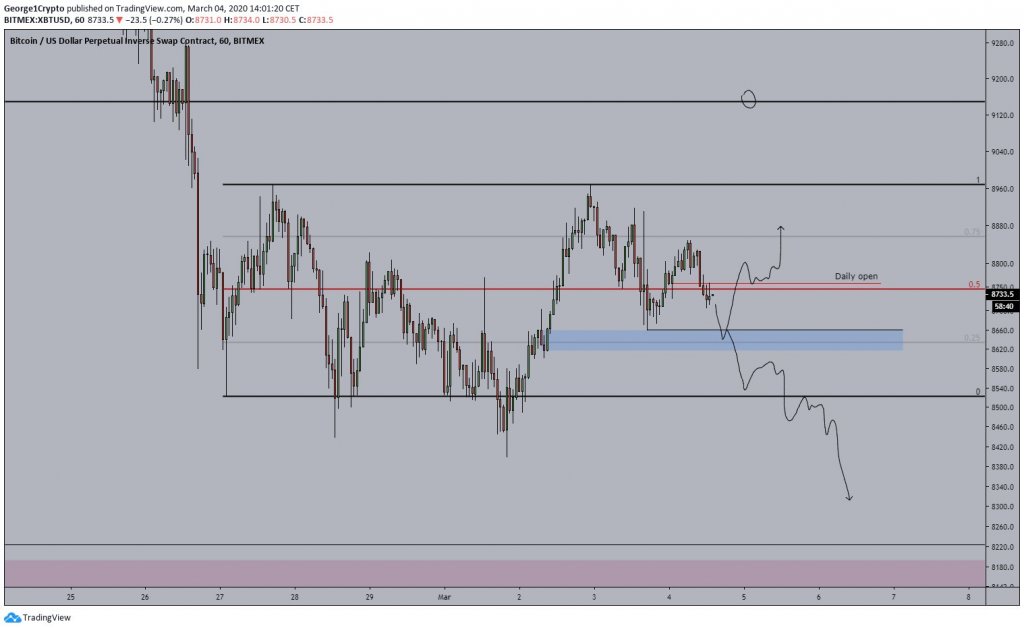
These two liquidity pools are critical for determining where Bitcoin trends next
The cryptocurrency market has been firmly range-bound for the past couple of days, which has been rooted in Bitcoin’s inability to garner any direction in the time following its recent break below $9,000. дальше »
2020-3-5 03:32 | |
|
|

Ethereum’s Price May Soon Explode Even Higher as Key Metric Breaks Out
Over the past day, the crypto market has effectively flatlined. Per data from CoinMarketCap, Bitcoin has gained 0. 12% in the past 24 hours, and Ethereum has shed 0. 6%. Despite this consolidation, there are signs that the market is about to break out after Saturday’s non-action, most likely in the upward direction. дальше »
2020-2-23 10:09 | |
|
|
These three cryptocurrencies could serve as a hedge against Bitcoin
The cryptocurrency market tends to move in one direction, which is mostly defined by Bitcoin’s price action. However, a recent report shows that several cryptos have proved to be highly uncorrelated. дальше »
2020-1-29 23:00 | |
|
|

Bitcoin Dominance Does Not Signal Altcoin Season, Here’s Why
The number designating the dominance of Bitcoin (BTC) may be a faulty metric, especially when estimating the potential of altcoins. Instead, the metric has been proposed as a way to gauge the market direction. дальше »
2020-1-18 02:00 | |
|
|
Bitcoin’s bull run may have started last week based on this technical index
Bitcoin could have entered a new bull market last week based on a technical indicator that has been extremely effective at determining previous parabolic movements. Determining the trend’s direction In a recent tweet, Sawcruhteez, a financial analyst and swing trader, emphasized that the parabolic SAR presented a buy signal on BTC’s 1-week chart. дальше »
2020-1-13 21:00 | |
|
|
Bitcoin Futures Volumes Explode After Price Swing
The Bitcoin (BTC) futures market reawakened in early 2020, following more active price action on the spot markets. Across the board, leading futures trading platforms saw significant growth. Bitcoin Futures Volumes and Open Interest Peak as Prices Move Bitcoin futures bet on the price direction, and open interest as well as trades increased with the promise of higher volatility. дальше »
2020-1-9 21:00 | |
|
|
Iran Ignites Stock Market Doom: Even the Fed Can’t Save a Dow Jones Crash
A sharp drop in the Dow Futures indicates the U.S. stock market did not price in direct attacks on U.S. troops by Iran and the precarious direction the conflict has taken. The post Iran Ignites Stock Market Doom: Even the Fed Can’t Save a Dow Jones Crash appeared first on CCN.com дальше »
2020-1-8 04:38 | |
|
|
Cosmos Hits Five-Months High While Market Struggles for Direction
The cryptocurrency market continues its struggle to find a directional bias over the Christmas holiday period, with most coins in the top 20 trading sideways. Bitcoin held support around the $7,100 level after being quickly sold off from the $7,430 level on Thursday. дальше »
2019-12-27 16:31 | |
|
|
Why Bitcoin Just Dropped Below $6900 in Abrupt Drop, Risking a Big Fall
Bitcoin (BTC) has just lost the key support of $7,000 after trading above this level for over a week. This marks the first bout of volatility the cryptocurrency market has seen in weeks and, as such, may imply that a larger move in the downward direction may take place in the coming days. дальше »
2019-12-16 21:48 | |
|
|
Bitcoin Eyes Crash Towards $6K as Market’s Distress Grows
Bitcoin opened on a faint note this Monday as the market showed a lack of sense of direction owing to low volatility. The world’s leading cryptocurrency was trading at around $7,575. 27 as of 1429 UTC after rising by 0. дальше »
2019-12-10 18:43 | |
|
|
Dow Recoups 275 Points as China Manipulates the Market - Again
The Dow and broader U. S. stock market began their long road to recovery on Tuesday after the People's Bank of China (PBoC) announced it would take decisive measures to stabilize the yuan. In other words, PBoC is manipulating the currency market in the direction that appeases stock traders. дальше »
2019-8-7 22:26 | |
|
|

Bitcoin Futures Activity Dictating Market Direction as Price Surpasses $12,000
It has been another day of gains on crypto markets and yet again bitcoin price is surging. Just like yesterday, traders in Asia are dictating movements as BTC shot past $12,000 a couple of hours ago. дальше »
2019-8-6 11:46 | |
|
|
Fed Rate Cut Supports Teetering Stock Market…Again
Some say there are only two rules one needs to follow in order to succeed in the stock market. The first rule is “don’t fight the tape”. The second rule is “don’t fight the Fed”. дальше »
2019-8-1 11:00 | |
|
|
Dow Lags S&P 500, Nasdaq After GDP Dump Squashes Recession Talk
The Dow lagged the broader U. S. stock market on Friday after Dow Inc. (NYSE:DOW), one of its major components, reported declining second-quarter profits and lowered its guidance for capital expenditures. дальше »
2019-7-27 22:00 | |
|
|
CRO Price Prediction: Long-term (CRO) Value Forecast – July 20
CRO/BTC trading operations have now resorted to featuring a series of downward price movements. The CRO/USD market bulls’ breakout of the B0. 000006 mark could be a signal to getting to witness some price territories in the direction of northwards. дальше »
2019-7-20 11:08 | |
|
|
Dow Struggles to Extend Rally as Market Braces for Earnings Disaster
The Dow and broader U. S. stock market struggled for direction Monday, just one session removed from a new all-time high, as investors quickly shifted their focus to corporate earnings season. Dow Struggles for Direction U. дальше »
2019-7-16 22:06 | |
|
|
Dow Uber-Bulls Fantasize About 28,000 – Here’s Why Bears Fear a Slump
The Dow Jones Industrial Average and the broader US stock market are having the time of their lives even as the US-China trade war keeps raging on and key economic indicators move in the wrong direction. дальше »
2019-7-15 20:06 | |
|
|
MAKER Price Prediction: Long-term (MKR) Value Forecast – July 14
MKR/USD trade operations still feature in a range despite a rise and a fall in its price moves. The two market movers may continue pushing the market until the next sessions as long as price lines at $800 and $600 remain unbroken either ways of the direction. дальше »
2019-7-14 07:14 | |
|
|
Bitcoin (BTC) Remains Bearish Till it Breaks Past $12,500, Analyst Says
While confusion looms as a result of uncertainty concerning the Bitcoin price movement, a crypto market analyst Josh Rager has given a little direction on the future of the king cryptocurrency. In a recent tweet, he said Bitcoin closing below $11,138 will indicate a continuing bearish trend while a price above $12,500 will be a […] The post Bitcoin (BTC) Remains Bearish Till it Breaks Past $12,500, Analyst Says appeared first on ZyCrypto. дальше »
2019-7-13 19:51 | |
|
|
4 Entertaining Bitcoin Price Predictions for This Week
It is rather easy to see how the current cryptocurrency market trend is not necessarily heading in the direction traders and speculators want to see. Despite the Bitcoin price showing bullish signs these past few days, it now seems all of that positive momentum has disappeared once again. дальше »
2019-7-11 23:00 | |
|
|
Cardano Bets on ADA’s Increased Liquidity to Attract Institutional Investors into the Market
Cardano, a decentralized public blockchain and cryptocurrency project intends to attract institutional investors into the cryptocurrency market by increasing the liquidity and accessibility of its virtual asset, ADA. дальше »
2019-7-10 22:14 | |
|
|
Dow Plunges After Fireworks as June Jobs Report Strangles Fed Outlook
The Dow and broader U. S. stock market opened sharply lower Friday after a stronger-than-expected jobs report worked against the narrative that the Federal Reserve needs to cut interest rates to steer the economy in the right direction. дальше »
2019-7-6 16:49 | |
|
|
Two Long-Term Bulls Butt Heads Over Short-Term Bitcoin Price Direction
Bitcoin is yet again at a critical inflection point, where the days ahead may determine the trend for the coming months and potentially years in the crypto market. After a flash crash stopped Bitcoin’s parabolic advance short ahead of setting new all-time highs, many fear that the rally may be ending and will test lows. дальше »
2019-7-5 03:01 | |
|
|
Dow Posts Surprising Rally as U.S. Treasury Yields Resume Plunge
The Dow and broader U. S. stock market pulled ahead on Tuesday, even as fears of an economic downturn pushed investors into in the safety of government bonds, sending U. S. Treasury yields to their lowest level since 2016. дальше »
2019-7-3 22:13 | |
|
|
Bitcoin chart analysis against patterns of other assets highlights future possibilities, not conclusions
Chart and pattern Analysis is a major part of analysing and predicting traditional stock, commodities and cryptocurrency trading in the financial market. The price and valuation of these assets over time and different market trends are often used to gauge several metrics and predict future trends, market volatility, price direction etc. дальше »
2019-7-1 18:30 | |
|
|

Want To Make It Big in the Next Bitcoin Rally? Use These 3 Tools
Bitcoin currently dominates the cryptocurrency market. Its price movements often determine the price direction of altcoins. A rally in Bitcoin’s price often tends to lift prices of many altcoins, while a BTC price drop usually causes the altcoin market to bleed. дальше »
2019-6-25 21:14 | |
|
|
WANCHAIN Price Prediction Today: Daily (WAN) Value Forecast – June 20
The $0.40 lower range mark has been assumed to be the defining point to both the north and the south direction of the WAN/USD market as at this point in time. The bulls may eventually find a way of coming back while the bears can't push the market line below $0.40 mark. WAN/USD Medium-term Trend: […] дальше »
2019-6-21 21:10 | |
|
|
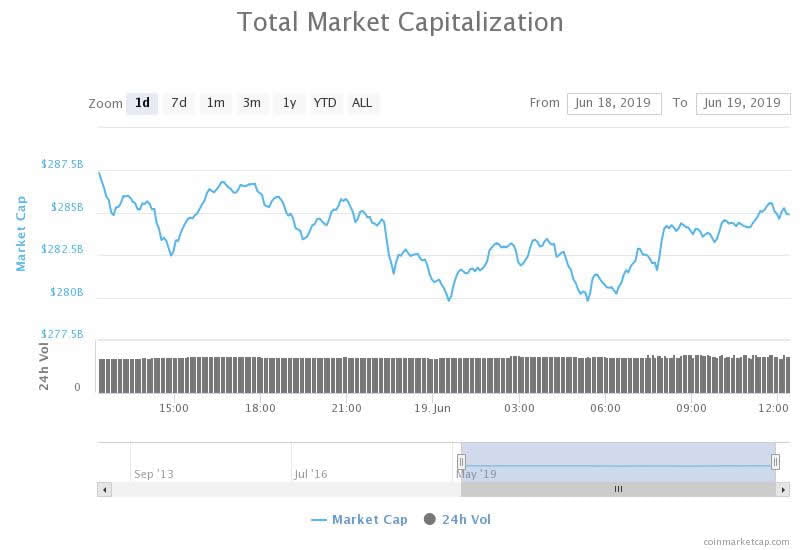
Crypto Market Wrap: All Eyes On Bitcoin as Altcoins Consolidate
Crypto markets consolidating today; Bitcoin takes a breath, LTC back up, XRP, EOS and Tezos retreating. Market Wrap Crypto markets have remained in consolidation for the past 24 hours. Very little movement has occurred on most of the majors as Bitcoin shows no direction at the moment. дальше »
2019-6-19 10:00 | |
|
|
OMISEGO Price Prediction Today: Daily (OMG) Value Forecast – June 12
OMG/USD market has now been dominated by higher highs than higher lows in a range moving settings. The OMG/USD trade's baseline defining the direction to the north has been observed at $1.90 mark, and any downward price movement to break it to the south could lead in getting the bears trapped afterward. OMG/USD Medium-term Trend: […] дальше »
2019-6-13 22:21 | |
|
|
Chinese Bitcoin Trader Commits Suicide after Losing 2,000 BTC on 100x Leverage Bet
By CCN Markets: A Chinese Bitcoin trader has allegedly committed suicide after he lost investor’s money in a highly leveraged trade position. According to 8btc, Hui Yi lost 2,000 Bitcoins after he entered a short position which was liquidated after it went in the opposite direction. дальше »
2019-6-12 15:18 | |
|
|
Ethereum (ETH) Going Down To $200 Unless There’s A ‘Miracle’
Various analysts have taken their turns on Twitter to voice their opinion on the new direction the Ethereum market is headed. In their views, things have taken another turn, with a couple of sell orders sending the crypto asset’s price further down in the past few days. дальше »
2019-6-10 16:18 | |
|
|
Price Watch: Is Bitcoin On A Downward Trend To $6,800?
Over the last few days, the crypto market has been a little undecided on which direction to take, with top coins like Bitcoin swinging up and down in price. A few days ago, Bitcoin touched the $9k crest before plummeting all the way down to $7,718. дальше »
2019-6-4 21:12 | |
|
|
The World’s Biggest Crypto Exchange is Testing a British Pound Stablecoin
By CCN: Binance CEO Changpeng Zhao let the cat out of the bag on Twitter late last night: Binance is launching its own stablecoin. Binance’s Last Mile: Its Own Liquidity Market? A user hoped to see a true stablecoin, pointing out that all of the existing options were down at least 2%. дальше »
2019-6-4 18:19 | |
|
|
Cardano (ADA) Price Analysis and Prediction for 2019 – Shorter Timeframes Reversing To Bullish Trend (May 29th Update)
4h ADABTC On the short timeframe of 4H, there is a lot of going on. But generally, things are not looking too good for ADA as it seems that bitcoin will soak up all attention of the market, again. дальше »
2019-5-29 14:37 | |
|
|
Cardano (ADA) Price Analysis and Prediction for 2019 – ADA Needs To Hold 980 Sats Or Else … (May 26th Update)
Mid May Update: Technicals 4h ADABTC On the short timeframe of 4H, there is a lot of going on. But generally, things are not looking too good for ADA as it seems that bitcoin will soak up all attention of the market, again. дальше »
2019-5-26 05:06 | |
|
|
Crypto Analyst: Bitcoin Price Forming Symmetrical Triangle, 60% Chance of Continuation
All eyes are currently on Bitcoin price, as the leading crypto by market cap has taken a pause in its parabolic advance, and the market watches and waits to see which direction the value of the asset goes in next. дальше »
2019-5-23 23:00 | |
|
|
Cardano (ADA) Price Analysis and Prediction for 2019 – ADA Is In Trouble Again (May 23rd Update)
Mid May Update: Technicals 4h ADABTC On the short timeframe of 4H, there is a lot of going on. But generally, things are not looking too good for ADA as it seems that bitcoin will soak up all attention of the market, again. дальше »
2019-5-23 04:45 | |
|
|

Binance Coin Continues to Shine as Bitcoin Seeks Direction
Binance Coin (BNB) continues to reach back to back 2019 all-time highs and its success has some analysts wondering if it will outperform Bitcoin over the long-term. Market Overview On Tuesday Binance Coin (BNB) [coin_rice coin=binance-coin] notched a new all-time high of $32. дальше »
2019-5-23 23:00 | |
|
|
Cardano (ADA) Price Analysis and Prediction for 2019 – Another Bitcoin Squeeze And ADA Is In Trouble Again (Mid May Update)
Mid May Update: Technicals 4h ADABTC On the short timeframe of 4H, there is a lot of going on. But generally, things are not looking too good for ADA as it seems that bitcoin will soak up all attention of the market, again. дальше »
2019-5-20 04:52 | |
|
|
NEO Price Prediction: Long-term (NEO) Value Forecast – May 19
NEO/USD still in a bullish trend outlook in spite of a notable line of declines in its market valuation. The two SMAs have now formed together to define the NEO/USD trade's movements to the north direction. дальше »
2019-5-19 12:29 | |
|
|
Who Do You Trust? A Survey of Best Exchange Options in 2019
It’s no secret to cryptocurrency experts that the industry had a rough year in 2018. But 2019 seems to have started off in a better direction. Bitcoin has exploded to over $8,000 and is showing strong support at those levels. дальше »
2019-5-16 12:02 | |
|
|
This Technical Indicator Predicts Bitcoin above $300K by 2021
The bitcoin price could discover new highs above $300,000 by 2021, according to a popular technical indicator. Dubbed as the Stochastic RSI, the indicator helps investors identify oversold and overbought conditions inside the market. дальше »
2019-5-12 19:00 | |
|
|
Bitcoin SV Price Prediction: Long-term (BSV) Value Forecast – May 11
BSV/USD market still moves in a range around $60 mark under the sell signal of the 50-day SMA indicator. The SMA indicators need to be broken upwards to allow the bulls to set a decent direction to the north. дальше »
2019-5-11 12:42 | |
|
|