Новости о Macd Bullish [ Фото новости ] [ Свежие новости ] | |

BNB backslides after hitting ATH: What to expect this week
BNB corrects 10% below its all-time high with a slightly bearish RSI of 49.91. Rising MACD and high social dominance hint at possible bullish rebound. After hitting an all-time high last weeThe post BNB backslides after hitting ATH: What to expect this week appeared first on AMBCrypto. дальше »
2024-6-11 13:00 | |
|
|
MANA Price Gets 2.5% Weekly Boost As Bulls Charge For Reversal
This week, MANA showcased a slew of 2. 5% gains. EMAs are also moving above Decentraland’s token’s price. MANA price tallies 2. 5% gains MACD looks flat and not showing any bullish sign Decentraland market cap at $1. дальше »
2022-9-29 06:27 | |
|
|
Bitcoin (BTC) Monthly MACD Could Soon Give Bullish Signal That Preceded Previous Uptrends
Bitcoin (BTC) has resumed the ascent which began on Sept 7 and created a large bullish candlestick on Sept 12, reaching an important resistance area in the process. The post Bitcoin (BTC) Monthly MACD Could Soon Give Bullish Signal That Preceded Previous Uptrends appeared first on BeInCrypto. дальше »
2022-9-13 11:30 | |
|
|
Bitcoin Weekly Momentum Flips Bullish For First Time In 2022: What Data Says
Bitcoin price is back at $48,000 and with the most recent weekly close, momentum has flipped bullish for the very first time this year. With the momentum now behind bulls, what might this mean for the cryptocurrency market in the weeks and months ahead? The MACD And Bullish Weekly Bitcoin Momentum Markets are always seeking equilibrium. дальше »
2022-3-30 18:00 | |
|
|
Bitcoin Weekly Momentum Flips Bullish For First Time In 2022: What This Means
Bitcoin price is back at $48,000 and with the most recent weekly close, momentum has flipped bullish for the very first time this year. With the momentum now behind bulls, what might this mean for the cryptocurrency market in the weeks and months ahead? The MACD And Bullish Weekly Bitcoin Momentum Markets are always seeking equilibrium. дальше »
2022-3-29 18:00 | |
|
|
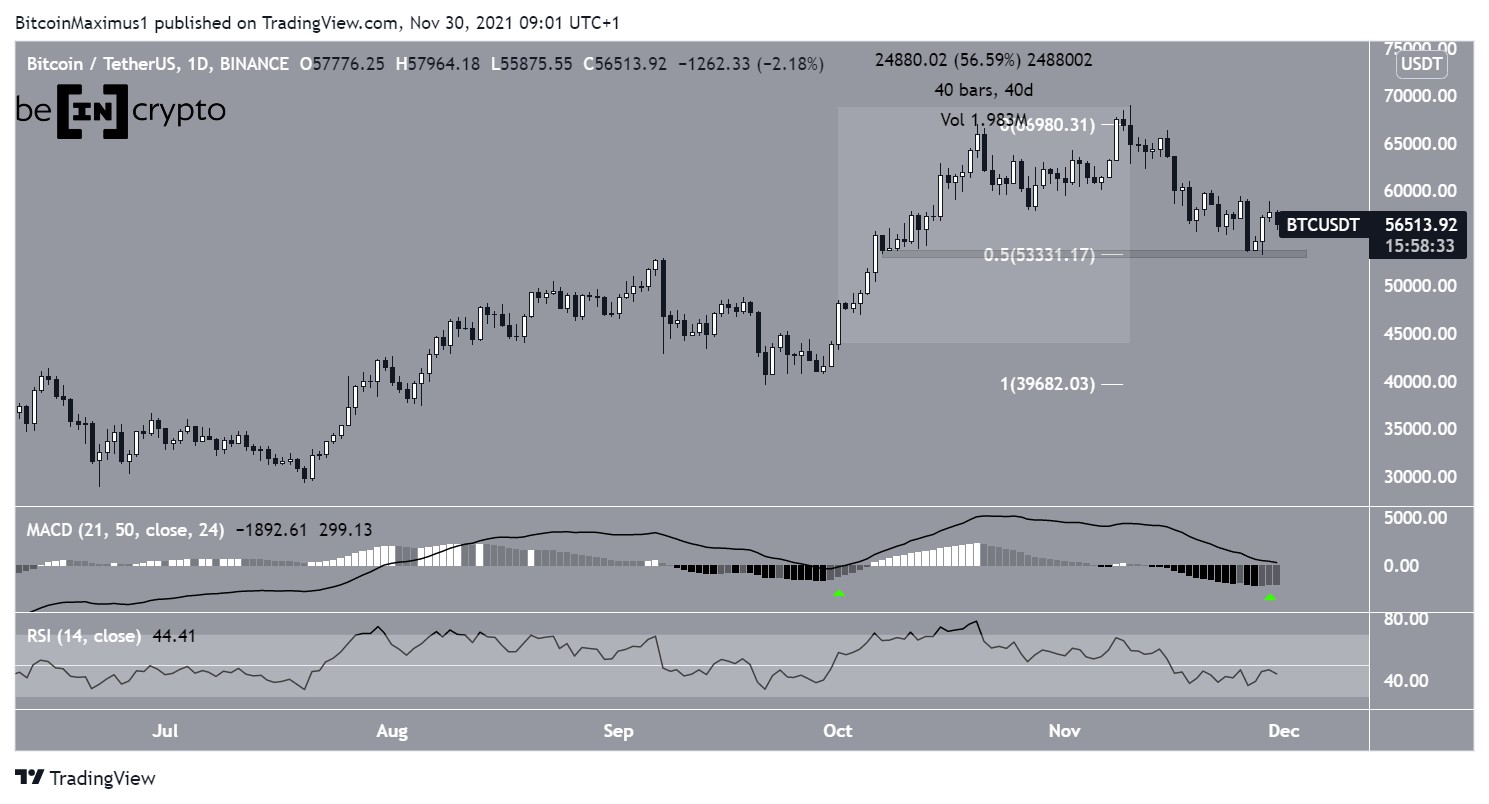
Bitcoin MACD Shines Bullish Signal After Nearly Two Months
Bitcoin (BTC) is attempting to break out from a short-term descending resistance line. Doing so would confirm that the correction is complete. The post Bitcoin MACD Shines Bullish Signal After Nearly Two Months appeared first on BeInCrypto. дальше »
2021-11-30 12:16 | |
|
|
Bitcoin Cash ready for an extended recovery but...
While the last 8 days have been rough for Bitcoin Cash, its streak of higher lows remained intact. Following a 26% decline between 11-18 November, a bullish crossover along the MACD and an oversold RSThe post Bitcoin Cash ready for an extended recovery but... appeared first on AMBCrypto. дальше »
2021-11-20 13:30 | |
|
|
While Chainlink prepares for recovery, long bets still not ideal. Here's why
Chainlink has laid the ground for a recovery following an oversold RSI and a bullish crossover on the MACD. A move above the 4-hour 20-SMA and 38.2% Fibonacci level would open a route towards the $34-The post While Chainlink prepares for recovery, long bets still not ideal. Here's why appeared first on AMBCrypto. дальше »
2021-11-20 21:00 | |
|
|
This support zone can maintain Chainlink's bullish outlook
A series of higher highs and higher lows have set Chainlink up for success as it prepares for a decisive close above the 50% Fibonacci level. However, a risk-off broader market and MACD's sell signal The post This support zone can maintain Chainlink's bullish outlook appeared first on AMBCrypto. дальше »
2021-10-31 00:30 | |
|
|

Bitcoin's weekly MACD just crossed bullish for the first time in 11 months
MACD is green for the first time since Bitcoin's all-time highs, but a correction is the "most obvious" first step, one trader says. дальше »
2021-8-18 18:37 | |
|
|

Bitcoin Prints Strongest Bull Signal, MACD Indicator shows bullish crossover on 3D chart that happened after 400 days
The moving average convergence divergence (MACD) is yet again proving to be a strong bullish Bitcoin indicator that may soon see a trend reversal and end bitcoin’s months-long price consolidation. дальше »
2021-7-13 14:30 | |
|
|
What Changed in Crypto Markets While You Were Sleeping — April 5
Bitcoin (BTC) update After creating a hanging man candlestick the week prior, BTC created a small bullish candlestick this week. Technical indicators are showing weakness. The MACD has created a lower momentum bar and the RSI is decreasing, nearly crossing below 70. дальше »
2021-4-5 10:19 | |
|
|
Tron, Ontology, Dogecoin Price Analysis: 30 March
Tron can be projected to break above its $0.067-resistance on the back of strong trading volumes and a bullish MACD. Ontology could retrace towards $1.47, but its uptrend was expected to remain intacThe post Tron, Ontology, Dogecoin Price Analysis: 30 March appeared first on AMBCrypto. дальше »
2021-3-30 21:00 | |
|
|
Crucial Weekly Bitcoin Momentum Indicator Opens Red For First Time Since April
Across crypto Twitter, analysts claim that Bitcoin price just had an extremely bullish close, but a crucial momentum measuring indicator says otherwise. In fact, the tool just flipped bearish for the first time on weekly timeframes since April 2020, right after the Black Thursday rebound and pre-halving rally. дальше »
2020-9-29 04:00 | |
|
|

Ethereum Shows First Bullish Buy Signal For Over a Year
Ethereum has been amongst altcoins showing double-digit gains and it’s long term technical indicators are turning bullish once again. Ethereum Crosses Weekly MACD It would be fair to say that Ethereum is still deep within a two-year bear market. дальше »
2020-1-16 12:00 | |
|
|

Ethereum MACD Crosses on the Weekly For the First Time in a Year
A key price indicator has turned bullish for ethereum on the long term chart of weekly price candles. MACD, which looks at momentum and trend direction over weekly periods in... The post Ethereum MACD Crosses on the Weekly For the First Time in a Year appeared first on Trustnodes. дальше »
2020-1-16 17:25 | |
|
|
Bitcoin Chart Printed This Bullish Signal As Price Retook $7,400
Since plunging to $6,400 around December 18th and rocketing back to $7,000 the day later, Bitcoin has stalled, flatlining in the low-$7,000s as the market remains largely directionless. Related Reading: Why the Bitcoin’s Bearish MACD Cross May Not Plunge Price But on Saturday, BTC started to show that it had room to run, with the... The post appeared first on NewsBTC. дальше »
2019-12-30 22:32 | |
|
|
TRON Price Analysis TRX / USD: A Passing Storm
TRON has a bearish short-term bias, with the cryptocurrency trading at its lowest level since March 4th, 2019 The four-hour time frame shows that the TRX / USD pair is now making lower lows and lower highs The daily time frame still shows a large bullish pattern and positive MACD price divergence TRON / USD […] The post TRON Price Analysis TRX / USD: A Passing Storm appeared first on Crypto Briefing. дальше »
2019-7-17 16:40 | |
|
|

Bitcoin Price Analysis: BTC Bulls Eye $13.3K As Next Target
The Bitcoin FOMO rally is truly underway, as the #1 cryptocurrency extends its meteoric rise by a further 9. 4% today. With so much momentum picking up behind asset, where are bullish traders going to take it next? Bitcoin Daily Chart On the daily BTC/USD chart we can see that bitcoin price is showing no signs of slowing down. дальше »
2019-6-27 20:15 | |
|
|
TRON Price Analysis TRX / USD: $20M Buyback Bull Move
TRON has an increasingly bullish short-term outlook, with the cryptocurrency testing towards the current 2019 trading high The four-hour time frame continues to show a valid inverted head and shoulders pattern The daily time frame shows sizeable amounts of bullish MACD price divergence Fundamental Analysis TRON has gained momentum after the project announced a $20 […] The post TRON Price Analysis TRX / USD: $20M Buyback Bull Move appeared first on Crypto Briefing. дальше »
2019-6-25 16:24 | |
|
|
Trade Recommendation: (Zcash)ZEC/BTC – 104% profit potential
Coin: ZEC/BTC Time frame: 4-8 weeks Exchange: Binance Current Price: 0. 011 BTC Buy Zone: 0. 01-11 BTC Sell Zone: 0. 017 – 0. 022 BTC Profit Potential: upto 104% Time frame: 4-8 weeks Technicals and Growth Factor ZEC/BTC is showing bullish momentum on daily chart, There is a bullish candlestick arrangement since last few days. дальше »
2019-5-30 14:21 | |
|
|
EOS Price Analysis EOS / USD: Strong Buying
EOS has a bullish short-term outlook, with the cryptocurrency testing back towards the best levels of the year so far. The four-hour time frame shows that buyers have invalidated a head and shoulders pattern The daily time still shows bullish MACD divergence is present from June 2018 EOS / USD Short-term price analysis EOS has […] The post EOS Price Analysis EOS / USD: Strong Buying appeared first on Crypto Briefing. дальше »
2019-5-21 16:59 | |
|
|
Verge Price Analysis XVG / BTC: Showing Signs Of Life
Verge has a neutral short-term bias against Bitcoin, following a technical correction back towards its 200-period moving average on the four-hour time frame The XVG / BTC pair is technically bearish over the medium-term The daily time frame continues to show bullish MACD price divergence Verge / Bitcoin Short-term price analysis Verge has a neutral […] The post Verge Price Analysis XVG / BTC: Showing Signs Of Life appeared first on Crypto Briefing. дальше »
2019-5-21 16:23 | |
|
|
BAT / USD Price Analysis: Lost Momentum
Basic Attention Token has a neutral short-term trading bias, with the cryptocurrency falling back towards critical technical support BAT has a bullish medium-term outlook, with price trading well above the pair’s 200-day moving average Bearish MACD price divergence remains present on the daily time frame Basic Attention Token / USD Short-term price analysis BAT has […] The post BAT / USD Price Analysis: Lost Momentum appeared first on Crypto Briefing. дальше »
2019-5-6 18:08 | |
|
|
BCH / USD Price Analysis: Staging Recovery
BCH has a neutral short-term trading bias, with the BCH / USD pair testing towards its 200-period moving average on the four-hour time frame Bullish MACD divergence has now been reversed on the four-hour time frame BCH continues to hold price above its 200-day moving average Bitcoin Cash / USD Short-term price analysis BCH has […] The post BCH / USD Price Analysis: Staging Recovery appeared first on Crypto Briefing. дальше »
2019-5-2 17:16 | |
|
|
Crypto Analyst: Bitcoin MACD Being Overextended is Bullish, But Consolidation is Due
Bitcoin has once again become the subject of water cooler talk at banks and brokers once again, following a massive price surge at the beginning of April, that saw the value of the leading crypto by market cap rise by over $1,000 over the course of an hour. дальше »
2019-5-2 03:01 | |
|
|
Electroneum (ETN) Price Prediction 2019 – This Year Will Be Even Tougher for ETN (Late April Update)
Late April Update: Technical Analysis Electroneum has managed to stop the slide into nihility and broke through the down pulsing trendline. RSI has put about and moved upwards from the oversold zone and MACD histogram has formed a bullish divergence. дальше »
2019-4-30 00:44 | |
|
|
ADA / USD Price Analysis: Corrective Pullback
Cardano has a bullish short-term bias, with the cryptocurrency still trading well above its 200-period moving average The daily time frame chart is showing a large inverted head and shoulders pattern Bullish MACD price divergence remains present on the daily time frame chart from May last year Cardano / USD Short-term price analysis Cardano maintains […] The post ADA / USD Price Analysis: Corrective Pullback appeared first on Crypto Briefing. дальше »
2019-4-20 17:13 | |
|
|
Bullish signal suggests the bottom is in for bitcoin, says technical analyst
A trading indicator in the bitcoin markets suggests the bottom may be in, according to one technical analyst. The two-week MACD of bitcoin crossed into a buy signal on Apr. 1st, the first time since May 11th, 2015, the bottom of the market before it exploded in 2016-2017. дальше »
2019-4-18 09:59 | |
|
|
Basic Attention Token / USD Technical Analysis: Third Peak
Basic Attention Token has a bullish short-term trading bias, with price trading at its highest level since November 2018 The BAT / USD pair’s medium-term outlook remains bullish, with price trading above its 200-day moving average Bearish MACD divergence is present on the four-hour and daily time frames Basic Attention Token / USD Short-term price […] The post Basic Attention Token / USD Technical Analysis: Third Peak appeared first on Crypto Briefing. дальше »
2019-4-18 17:57 | |
|
|
Bitcoin Cash / USD Technical Analysis: Merging Fork
Bitcoin Cash has a bullish short-term bias, with the BCH / USD pair probing its current yearly trading high Bitcoin Cash has a bullish outlook over the medium-term horizon The daily time frame chart shows that any bullish MACD divergence has now been completely eradicated Bitcoin Cash / USD Short-term price analysis BitcoinCash has a […] The post Bitcoin Cash / USD Technical Analysis: Merging Fork appeared first on Crypto Briefing. дальше »
2019-4-16 16:28 | |
|
|

Nasty Pullback Inbound? Analyst Warns That Bitcoin (BTC) Isn’t Bullish Yet
Bitcoin MACD Looks To Cross Bearish, Sell-Off Possible Over the past 48 hours, Bitcoin has trended higher, posting a 2% gain in the past 24 hours after a 10% sell-off earlier this week, which optimists. дальше »
2019-4-15 10:00 | |
|
|

Tron Price Analysis – TRX/USD Rising Again
By Dmitriy Gurkovskiy, Chief Analyst at RoboForex Tron is continuing its rally on Tuesday, trading around $0. 0300. On D1, the MACD formed a golden cross, which signaled the bearish trend fadeout and the beginning of a bullish one. дальше »
2019-4-9 18:20 | |
|
|
Weekly MACD Histogram Most Bullish It’s Been Since Bitcoin Price Was Over $13K
The moving average convergence divergence (MACD) is a lagging indicator many analysts use to track longer-term trend changes in assets across a variety of markets. In Bitcoin, the histogram of this key indicator had been bearish throughout most of 2018 and into 2019, and only recently just rose into bullish territory during last week’s rally. дальше »
2019-3-5 23:00 | |
|
|

Dogecoin Price Prediction: DOGE Has Broken Out of the Downward Channel, Where Is It Heading Next?
Long-Term Outlook A look at the Weekly chart for Dogecoin shows that price is currently trading at $0. 0021, on the edge of the support area formed by previous lows. Furthermore, we can see that price has found support right above the 200-period MA. дальше »
2019-2-24 13:44 | |
|
|
Stellar Price Prediction: Did XLM Finally Make a Bottom at $0.07 and Are We Going to Move Past $0.1?
Long-Term Outlook A look at the Weekly chart for XLM / USD in logarithmic form shows that price is trading above the support area of $0. 06/$0. 07 created by the highs of April 2018. Price has created a small amount of bullish divergence with the RSI. дальше »
2019-2-23 14:19 | |
|
|
XRP Price Prediction: XRP Is Very Close to Breaking Through Resistance, When Will a Successful Attempt Occur?
Long-Term Outlook A look at the Weekly chart for XRP/USD shows that price is currently trading at $0. 33, slightly above the support area near $0. 28. The RSI is at 43, indicating neither overbought nor oversold conditions. дальше »
2019-2-21 12:54 | |
|
|

DASH Price Prediction: Price Breaks Out Above Resistance, Next Resistance at the 100-Day MA?
Long-Term Outlook A look at the Dash Weekly chart in logarithmic form shows that price briefly traded inside the support area at $45-$55, before starting an upward move and is now trading at $80. дальше »
2019-2-11 16:24 | |
|
|
Tron Price Prediction: The Second Attempt at Breaking Resistance Was Unsuccessful, Will Price Break Through on the Third One?
Long-Term Outlook A look at the Weekly chart for Tron shows that price is following a descending support line. Price is currently trading at $0. 026, slightly below the resistance area of $0. 028-$0. дальше »
2019-2-1 14:04 | |
|
|
Bitcoin price prediction: Possible descending wedge breakout
Long-term outlook: A look at the Weekly chart for Bitcoin shows that price is currently trading at $3640, finding steady support at the 200-period moving average. The RSI was below 30 for a short while, indicating oversold conditions. дальше »
2019-1-24 17:29 | |
|
|
Dogecoin Price Prediction: DOGE Is at the Lower Range of the Support Area, When Will It Start a Rally?
Long-Term Outlook A look at the Weekly chart for Dogecoin shows that price has fallen to the long-standing support area at $0. 002, which coincides with the 200-period moving average. Furthermore, the MACD is starting to turn and is getting ready to make a bullish cross. дальше »
2019-1-23 17:14 | |
|
|