Новости о Long-term Technical [ Фото новости ] [ Свежие новости ] | |


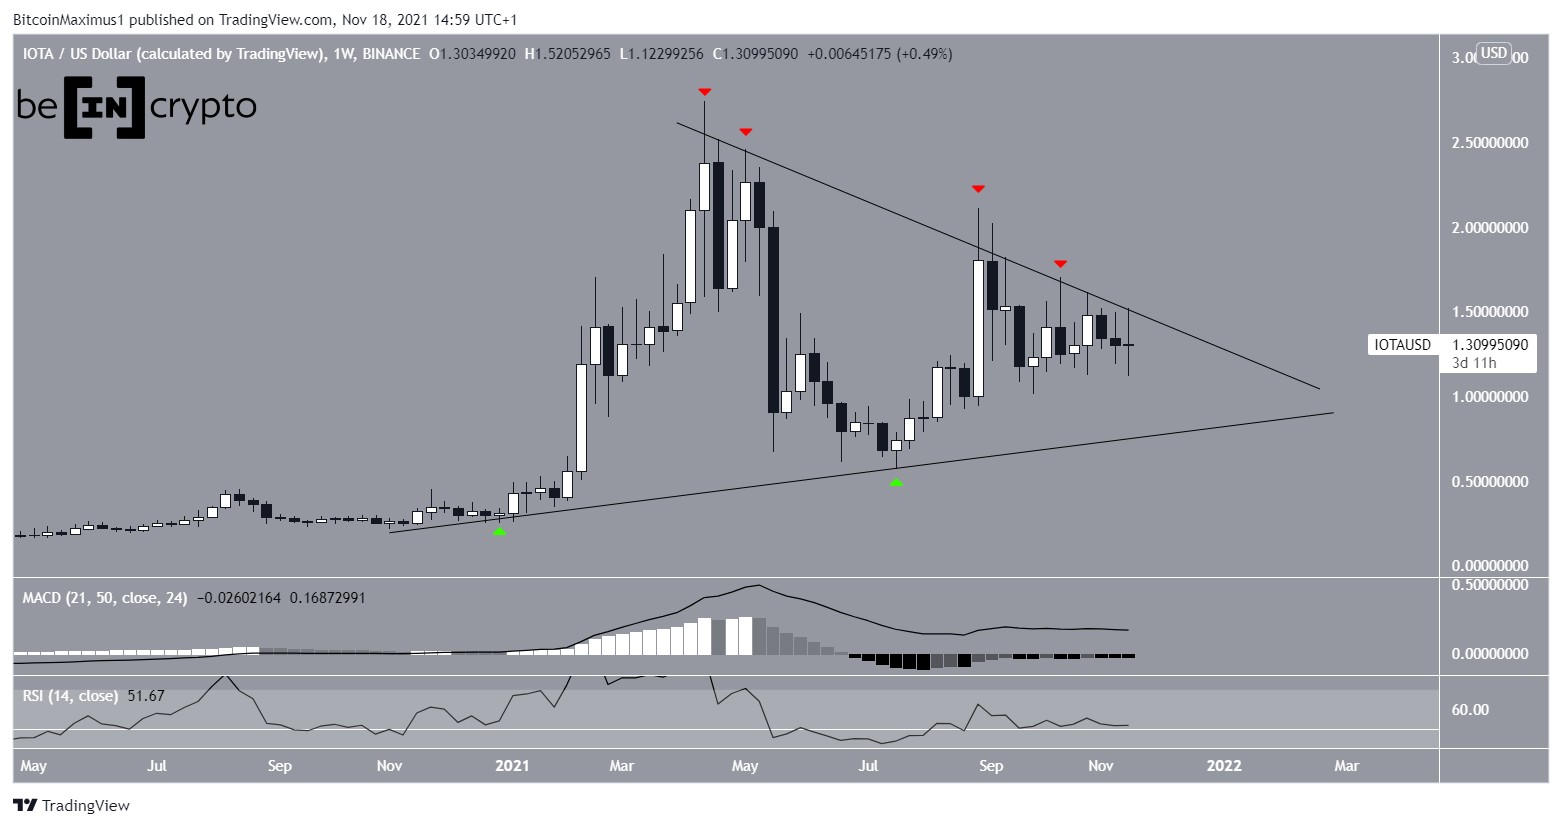
IOTA (IOTA) Fails to Break Out From Long-Term Pattern
IOTA is approaching the end of its pattern, but neither the price action nor technical indicator provide the direction of the next move. The post IOTA (IOTA) Fails to Break Out From Long-Term Pattern appeared first on BeInCrypto. дальше »
2021-11-19 20:56 | |
|
|
BTC, ETH, XRP, BAT, XMR, CRV, NANO—Technical Analysis June 8
Bitcoin (BTC) has broken down from a symmetrical triangle pattern. It is gradually approaching a long-term support level found at $27,000. The post BTC, ETH, XRP, BAT, XMR, CRV, NANO—Technical Analysis June 8 appeared first on BeInCrypto. дальше »
2021-6-8 12:19 | |
|
|
EGLD Sustains Bullish Trend With Bounce at Long-Term Support
Elrond (EGLD) has validated a long-term ascending support line for the sixth time. Technical indicators in the daily time-frame are bullish. The post EGLD Sustains Bullish Trend With Bounce at Long-Term Support appeared first on BeInCrypto. дальше »
2021-6-4 21:10 | |
|
|

Here Are Key Fundamental Factors Dictating Bitcoin’s Price Beyond The Charts
Using past data, technical analysis helps to predict the movement of the market and helps investors and traders spot buying opportunities on different occasions. However, long-term cryptocurrency investors will agree that technical analysis isn’t the full package. дальше »
2021-5-19 23:08 | |
|
|
BTC, ETH, XRP, ADA, XTZ, SOL, TRX: Technical Analysis For April 6
Ethereum (ETH) is re-testing the previous all-time high as support. XRP (XRP) is moving upwards and has nearly reached a long-term resistance level. Cardano (ADA) is trading inside a symmetrical triangle, from which a breakout is expected. дальше »
2021-4-7 21:02 | |
|
|
ICX, EGLD & UMA: Technical Analysis For March 30
Icon (ICX) has broken out from a symmetrical triangle. It is expected to continue increasing at least until it reaches $3. 30. UMA (UMA) has bounced at a long-term support level. However, it has yet to break out from a short-term descending resistance line. дальше »
2021-3-31 19:37 | |
|
|
BTC, ETH, XRP, STEEM, REP, BTT, CHSB & UNI: Technical Analysis For March 26
Ethereum (ETH) has bounced since re-testing its all-time highs. XRP (XRP) is trading close to long-term resistance at $0. 60. Steem (STEEM) has broken out from a nearly two-year-long resistance area and validated it as support afterward. дальше »
2021-3-27 19:20 | |
|
|
BCH, XVG & DNT: Technical Analysis For March 25
Verge (XVG) has broken down from an ascending support line and is attempting to find support. District0x (DNT) has been decreasing since creating a double top pattern on March 20. Bitcoin Cash (BCH) At the beginning of January, BCH broke out from a long-term descending resistance line. дальше »
2021-3-25 17:22 | |
|
|
Litecoin (LTC) Stuck Consolidating Below Long-Term Resistance
Litecoin is currently trading between resistance and support. While technical indicators are leaning bullish, a breakout is required for the bullish trend to be confirmed. Rejection from Long-Term Resistance Litecoin has been decreasing since Feb. дальше »
2021-3-11 15:33 | |
|
|
Ethereum (ETH) Targets $2,000 after Trading Sideways
Ethereum has now broken out from a short-term resistance. Both technical indicators and the price action suggest that more highs are in store. Long-Term Ethereum Movement The weekly chart shows that ETH has broken out above the $1,400 area, which previously acted as the all-time high resistance. дальше »
2021-2-18 08:37 | |
|
|
ADA, YFI, XMR – Technical Analysis for February 17, 2021
Both Cardano (ADA) and Monero (XMR) are facing crucial long-term resistance levels. The price action for the latter seems more bullish, making a breakout more likely. Cardano (ADA) ADA has been increasing rapidly since the beginning of February when it was trading at $0. дальше »
2021-2-17 16:22 | |
|
|
DigiByte (DGB) Bounces Back Toward Local Highs
Technical indicators, the wave count, and the price action for DigiByte support the continuation of the upward move toward $0. 084. DigiByte Long-Term Levels The weekly chart shows that DGB has been increasing rapidly since the beginning of February. дальше »
2021-2-15 13:31 | |
|
|
BTCD Continues Descent As Altcoins Increase
Technical indicators and the wave count suggest that BTCD will continue its descent until it possibly breaks down. Long-Term Levels BTCD has been moving downwards since being rejected by the 71. дальше »
2021-2-11 21:50 | |
|
|
OMG Network (OMG) Approaches Long-Term Resistance at $6.50
Due to OMG Network reclaiming the minor resistance area and the bullishness from technical indicators, it’s likely that the breakout will be successful. OMG Network Long-Term Levels The weekly chart shows that OMG is trading just below the long-term $6. дальше »
2021-2-10 16:30 | |
|
|
ONT Approaches Long-Term Resistance Line – Break Out Imminent?
However, neither the price move nor technical indicators confirm the possibility of a breakout. Long-Term Levels ONT has been following a descending resistance line since Sept. 2018, when it was trading at a high of $2. дальше »
2021-1-20 19:31 | |
|
|
NANO Pumps but Fails to Clear Crucial Resistance
While the longer-term trend seems to be bullish, the lack of structure and ambiguity in technical indicators makes the direction of the short-term trend unclear. NANO Long-Term Levels NANO began a significant upward move in the final week of December 2020, concluding with a high of $5. дальше »
2021-1-20 15:15 | |
|
|
BTCD Continues Descent After Rejection
Rejection From Long-Term Resistance During the week of Dec. 27 – Jan. 4, BTCD fell from the long-term 71. 5% resistance area. It has not traded above this level since June 2017. Despite the rejection, technical indicators are still bullish. дальше »
2021-1-11 23:03 | |
|
|
ETC Makes Fifth Attempt to Break Out Above $7.40
Both technical indicators and the wave count support the possibility of a breakout, which would take ETC to at least $9. 30. Long-Term Resistance ETC has been trading below the $7. 40 resistance area since the rapid decline in March. дальше »
2021-1-6 17:47 | |
|
|
SXP Risks Falling to All-Time Low, Will It Bounce?
However, technical indicators are bullish, suggesting that SXP will break out instead. Long-Term Resistance Line SXP has been decreasing rapidly since reaching a high of $5. 14 on Aug. 14. The fall has been swift, and SXP has been following a descending resistance line since Sept. дальше »
2021-1-6 21:30 | |
|
|
BAL’s Breakout Could Pave the Way for Higher Prices
The breakout from the former is significant, and when coupled with the bullish readings from technical indicators, it suggests that an upward move is likely. Long-Term Levels The daily chart shows that BAL had been following a descending resistance line since Sept. дальше »
2020-12-29 21:49 | |
|
|
0x (ZRX) Finds Relief Above Crucial Support
Despite ambiguity from technical indicators, 0x is expected to increase to the closest resistance area at $0. 425 and could possibly move higher after. 0x Long-Term Support Levels ZRX has been moving downwards since it reached a high of $0. дальше »
2020-12-29 13:27 | |
|
|
Ethereum Classic (ETC) Struggles to Overcome $7.50 Resistance
The price action and a variety of technical indicators suggest that ETC will be successful in breaking out. Ethereum Classic Long-Term Support Levels ETC has been following an ascending support line since November 2018 and has validated it four times since. дальше »
2020-12-21 13:21 | |
|
|
What Does BTCD Say About Another Altseason?
Technical indicators are bullish and support the possibility of a breakout. BTCD’s Long-Term Resistance BTCD is currently trading above a long-term resistance line that has been in place since Sept 2019. дальше »
2020-12-18 21:55 | |
|
|
Cardano (ADA) Fails to Overtake Crucial Resistance Level
Cardano (ADA) has failed to break out above a long-term descending resistance line and suffered a sharp drop after its rejection. Technical indicators suggest that the price is likely to continue its descent. дальше »
2020-10-30 10:31 | |
|
|
Troubles for Bitcoin Grow as Analyst Spots “Potential Death Cross”
Bitcoin is on the verge of painting a Death Cross. The technical chart pattern–which forms after an asset’s short-term moving average closes below its long-term moving average–holds credibility for predicting bearish markets. дальше »
2020-10-7 11:01 | |
|
|
SXP Breaks Down From Long-Term Support
The Swipe (SXP) price has broken down from a long-term support level. While the price is approaching a possible Fib reversal level, technical indicators do not yet show any bullish signs. Breakdown From Support The SXP price has been decreasing since it reached a high of $5. дальше »
2020-9-22 22:51 | |
|
|
Monero (XMR) Bullish Formation Still Intact Despite Market Correction
The Monero (XMR) price decreased sharply during the marketwide crash on Sept 2-4. However, its bullish formation is still intact, and technical indicators suggest that a reversal is brewing. XMR Long-Term Breakout In July, the XMR price broke out from a descending resistance line that had been in place since June 2018. дальше »
2020-9-9 09:37 | |
|
|
Two Altcoins That Could Soon Begin Moving Upwards
The Komodo (KMD) price is trading near its all-time lows. Technical indicators suggest an eventual upward move is expected. While TROY (TROY) has broken out from a long-term resistance area, it has failed to sustain the higher price and has decreased back below it. дальше »
2020-8-30 17:00 | |
|
|
Short-Term XRP Target At 40 Cents, What Ripple’s Long Road To Recovery Looks Like
After spending over two years running atop the worst crypto market performers list, XRP has potentially begun a long-term recovery. According to technical analysis patterns and statistics, a short-term target for XRP may be closer to 40 cents per token. дальше »
2020-8-4 04:00 | |
|
|
Why Bitcoin May Be In For a Fall Towards $6,000
Bitcoin risks plunging back towards $6,000 purely based on a historical technical setup. The analogy appears after switching a BTC/USD chart from normal to a more precise logarithmic scale. It shows that the cryptocurrency has not precisely broken above its long-term descending trendline resistance. дальше »
2020-7-29 14:00 | |
|
|

IOTA Attempts to Break Through Long-Term Resistance
The IOTA (IOTA) price is trading inside a long-term resistance area, a breakout above which could trigger a rapid increase. However, the price has fallen into a bearish pattern, and technical indicators are showing weakness, making a rejection much more likely. дальше »
2020-7-11 09:56 | |
|
|

Bitcoin Dominance Rate in a ‘Make or Break’ Position
The Bitcoin dominance rate (BTCD) is trading at a long-term ascending support line that has been in place since the beginning of February. Technical indicators suggest that the BTCD will break down from this line. дальше »
2020-6-24 16:05 | |
|
|
Bitcoin “Death Cross” Pattern that Last Crashed Price By 55% Appears Again
Bitcoin has come closer to forming a dreaded Wall Street chart pattern: the Death Cross. The bearish technical indicator materializes when an asset’s long-term moving average crosses above its short-term moving average. дальше »
2020-6-23 14:00 | |
|
|

When Will These Two Lagging Majors Begin to Move Upwards?
The EOS price has reclaimed the support area of a long-term trading range, indicating that it might begin to move towards resistance. DASH has yet to reclaim its own support area, but technical indicators are showing that it might soon do so. дальше »
2020-6-19 16:04 | |
|
|

Data Shows Ethereum Transactions Are Surging in 2020 as Institutions Jump Onboard
Ethereum, the world’s second-largest cryptocurrency by market cap, has shown strength in both fundamental and technical factors this year. The protocol has been increasingly adopted by enterprises as a blockchain tool and by investors for its long-term growth potential. дальше »
2020-6-9 19:00 | |
|
|
Bitcoin Continues Flooding Out of Exchanges as Number of Long-Term Investors Grows
The bull-case for Bitcoin continues growing stronger by the day. The benchmark cryptocurrency has been able to move above the $9,000 resistance level that was previously hampering its price action. дальше »
2020-5-14 01:00 | |
|
|
Bitcoin Readies to Surge as Sellers Get Hit with Technical Triple Whammy
Just weeks ago, Bitcoin’s long-term outlook was anything but bullish. As the macroeconomy started to feel the effects of the coronavirus outbreak, global markets crashed in tandem, leaving no asset classes spared, crypto included. дальше »
2020-4-26 13:00 | |
|
|
Chainlink Attracts More Long-Term Holders as Its Network Expands
Chainlink’s network continues to grow despite the financial havoc caused by the ongoing Coronavirus pandemic. Different technical indexes show that this altcoin could still go through a bearish impulse before...The post Chainlink Attracts More Long-Term Holders as Its Network Expands appeared first on Crypto Briefing. дальше »
2020-4-11 16:56 | |
|
|
Chainlink nears critical support as data shows long-term “hodlers” may be jumping ship
Chainlink (LINK) shocked cryptocurrency investors throughout 2019 and the early part of 2020, with the crypto incurring an unwavering uptrend that allowed it to post multiple parabolic cycles, rarely showing any signs of technical or fundamental weakness. дальше »
2020-3-26 13:00 | |
|
|
Bitcoin to Form Golden Cross but It Cannot Guarantee a Bull Run
Bitcoin traders are enthusiastic about a textbook technical indicator whose formation could send the asset’s prices higher. Dubbed as Golden Cross, the candlestick pattern will occur when bitcoin’s short-term moving average closes above its long-term moving average. дальше »
2020-2-14 18:00 | |
|
|
Bitcoin Explodes as Rare Bull Signal Flashes For the First Time in 10 Months
Bitcoin was trending higher through the early European session on Thursday as a very rare bull signal flashed for the first time in 10 months. Dubbed as Ichimoku Cloud, the technical indicator turned green to identify a long-term upside trend shortly after bitcoin surged towards $9,769. дальше »
2020-2-6 15:00 | |
|
|
Historically Accurate Bitcoin Price Indicator Just Signaled Start to a Long-Term Bull Market
A historically accurate bitcoin price indicator has just flipped its market bias to bullish after four months. Dubbed as Guppy Multiple Moving Average, or Guppy, the technical indicator identifies changing trends and potential price breakouts by adjoining an asset’s long and short term moving averages. дальше »
2020-1-27 15:00 | |
|
|
Trader Who Called $6,000 Bitcoin Bottom Predicts $100,000 By Late 2022
Technical analyst Dave the Wave sees $100,000 as the long-term target of bitcoin. He accurately predicted the BTC bottomin mid-$6,000s. The post Trader Who Called $6,000 Bitcoin Bottom Predicts $100,000 By Late 2022 appeared first on CCN.com дальше »
2019-12-27 14:29 | |
|
|
Here’s How Bitcoin Would Hit “Bizarre” $250,000 in Next Few Years
Long-term venture capitalist Tim Draper has doubled down on his prediction of $250,000 each Bitcoin in the next two years. Draper’s bold prediction isn’t based on any technical analysis because he doesn't “quite understand” them but he sees it “pretty likely that we’re gonna hit $250,000 by end of 2022 or early 2023 based on […] дальше »
2019-12-20 17:14 | |
|
|