Новости о Levels Historical [ Фото новости ] [ Свежие новости ] | |

What does Ethereum's latest revisit to key historical levels mean for you?
A surge in demand has been observed among U.S. investors, who appear eager to accumulate ETH Analysts predict the next potential price target could exceed $10,000, fueled by an anticipated rallThe post What does Ethereum's latest revisit to key historical levels mean for you? appeared first on AMBCrypto. дальше »
2024-12-6 09:00 | |
|
|
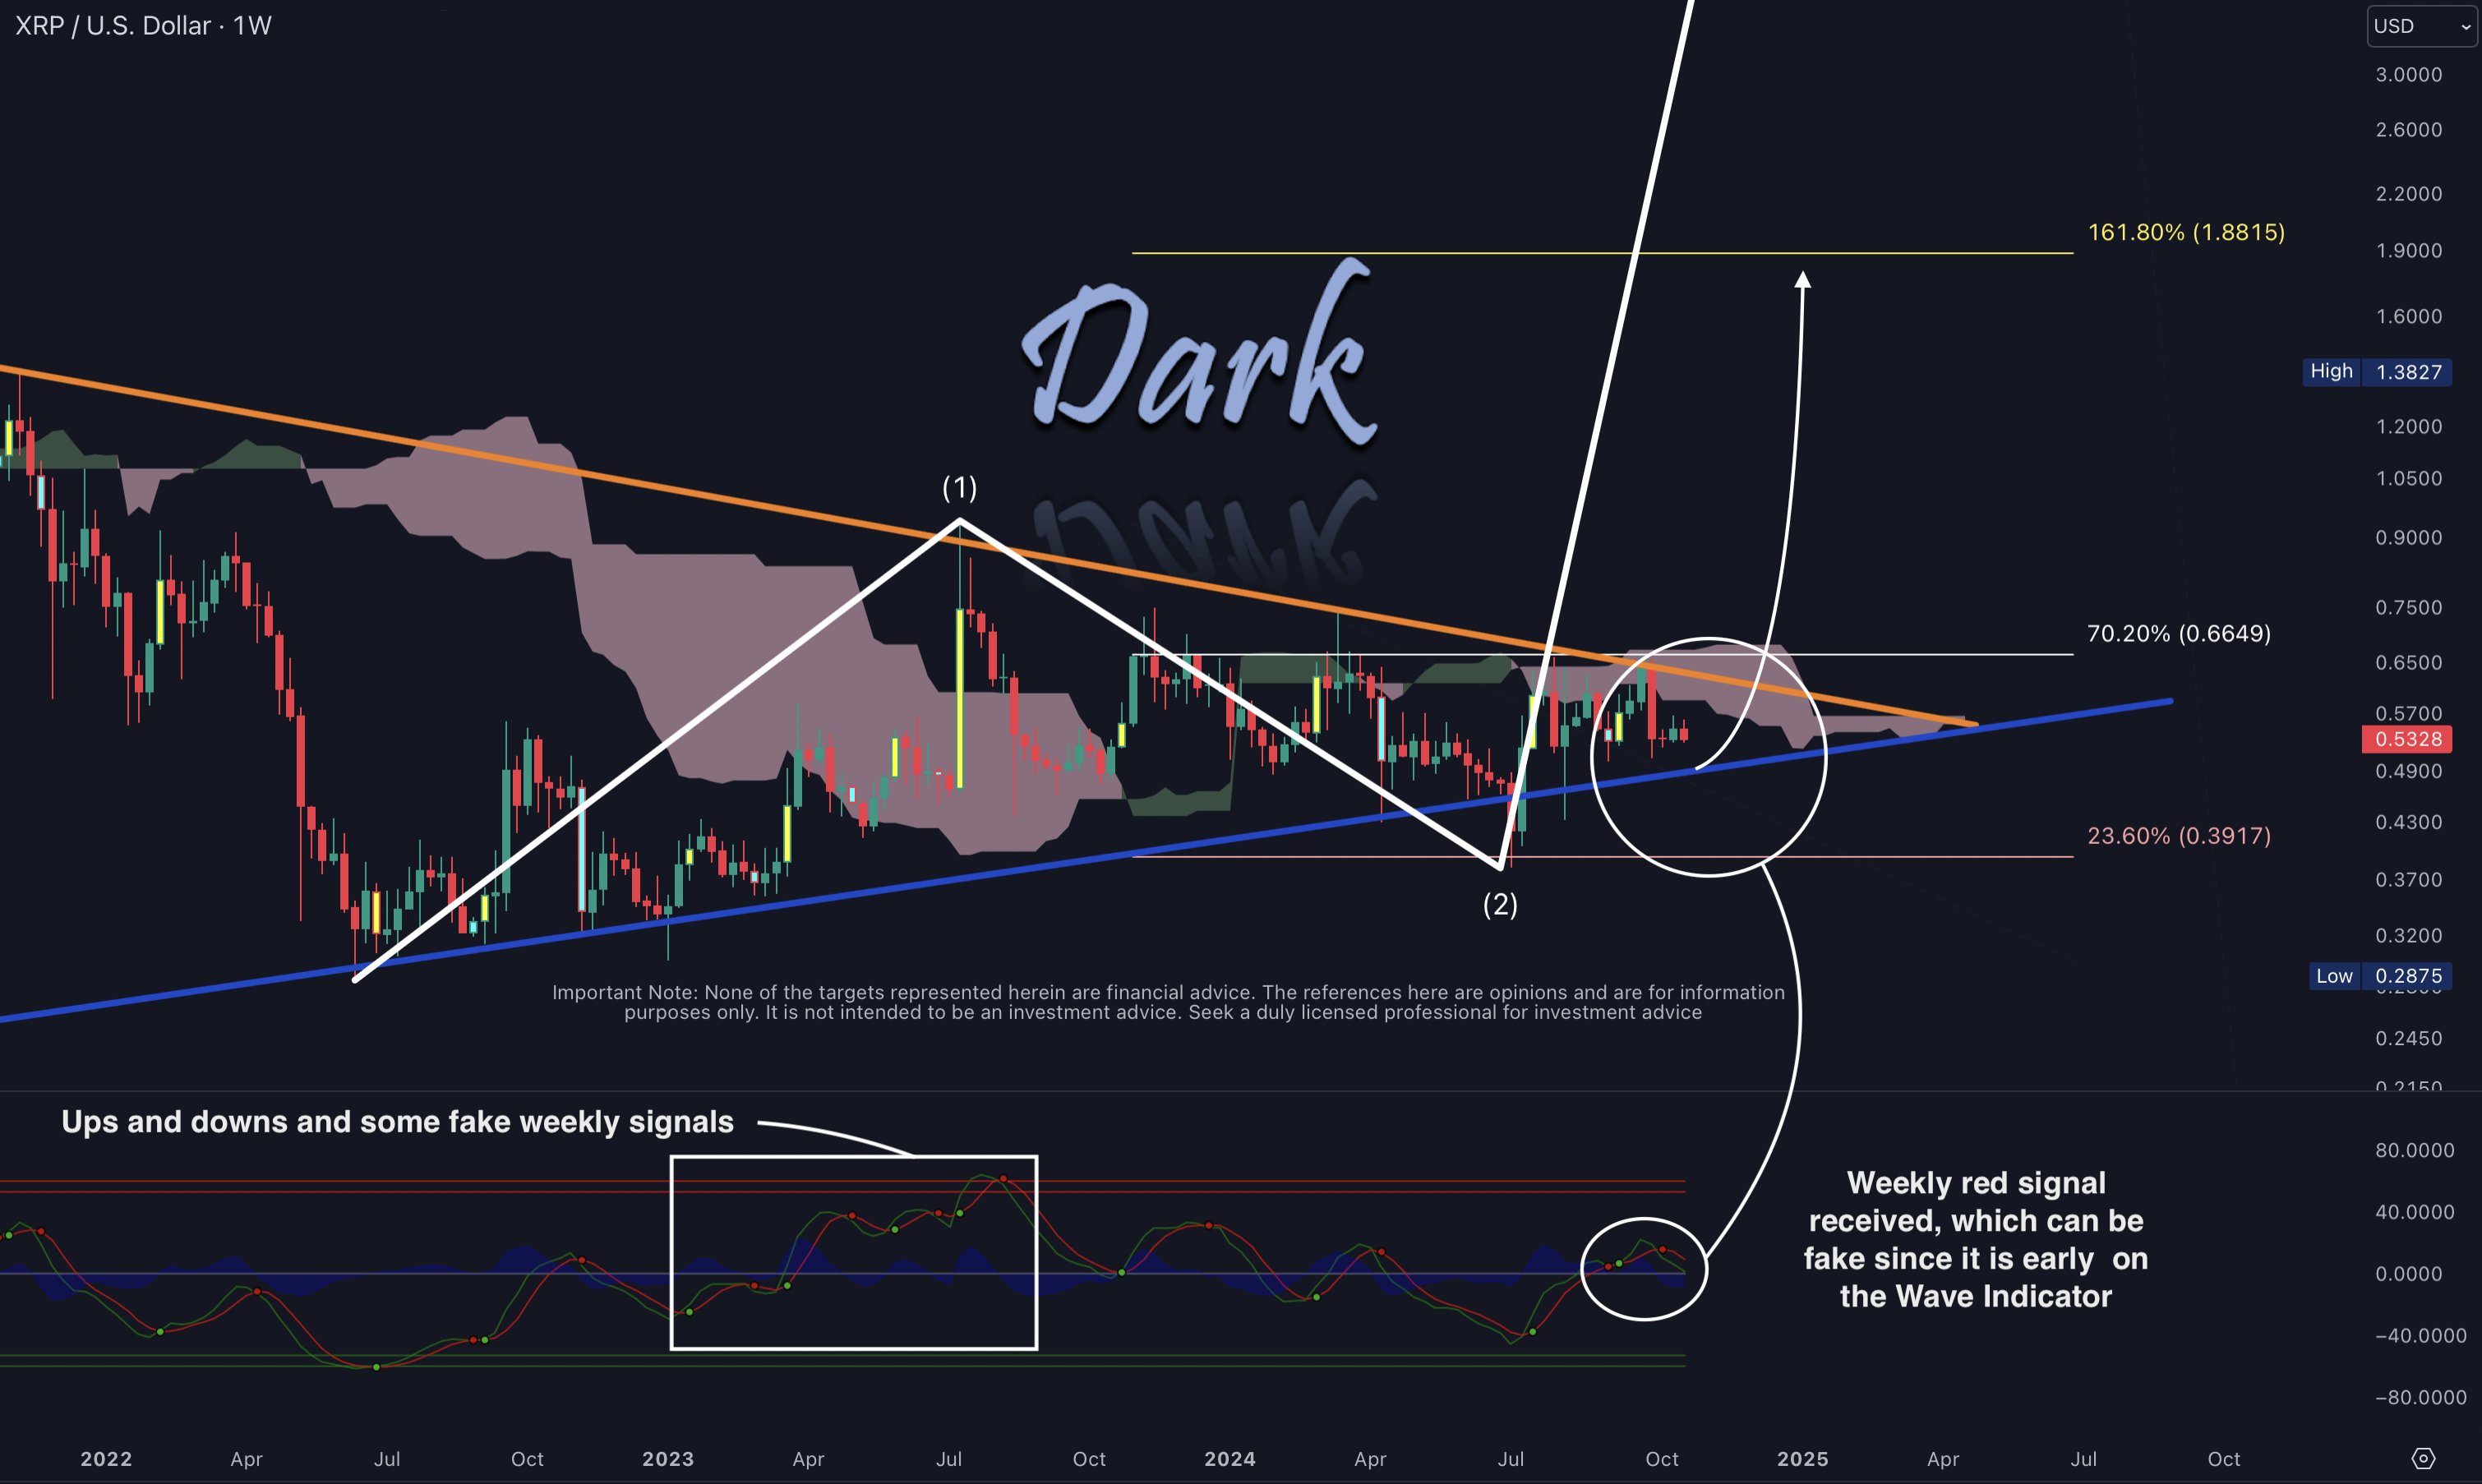
XRP Price Could Face Last Major Crash, Warns Crypto Analyst
In a new technical analysis of the XRP price in the weekly chart (XRP/USD), crypto analyst Dark Defender warns of a potential last major crash. The analysis uses the Elliott Wave theory and dives into the historical and projected paths for XRP, marked by critical price levels and wave patterns. дальше »
2024-10-24 17:00 | |
|
|

Bitcoin (BTC) Historical Data Signals October Bull Run Kickoff – Analyst
Bitcoin finds itself at a critical juncture after weeks of intense volatility, marked by excitement and fear. Currently trading around $59,400, BTC is testing vital demand levels following a 10% dip from local highs of approximately $66,000. дальше »
2024-10-5 10:30 | |
|
|

XRP Price Bollinger Bands Return To Levels That Triggered 650x Increase
The XRP price chart is displaying a familiar historical pattern that previously led to a massive 650X price surge. This pattern, known as the Bollinger Bands, is often used to predict the price movements of a cryptocurrency. дальше »
2024-9-23 17:30 | |
|
|
Will Polkadot fall below its $2 ATL? Assessing key levels
There is a risk that DOT could plummet to or below its historical low of $2.00 if it fails to hold the support level at $4.001. A noticeable lack of interest from retail investors indicates a pThe post Will Polkadot fall below its $2 ATL? Assessing key levels appeared first on AMBCrypto. дальше »
2024-9-3 01:00 | |
|
|
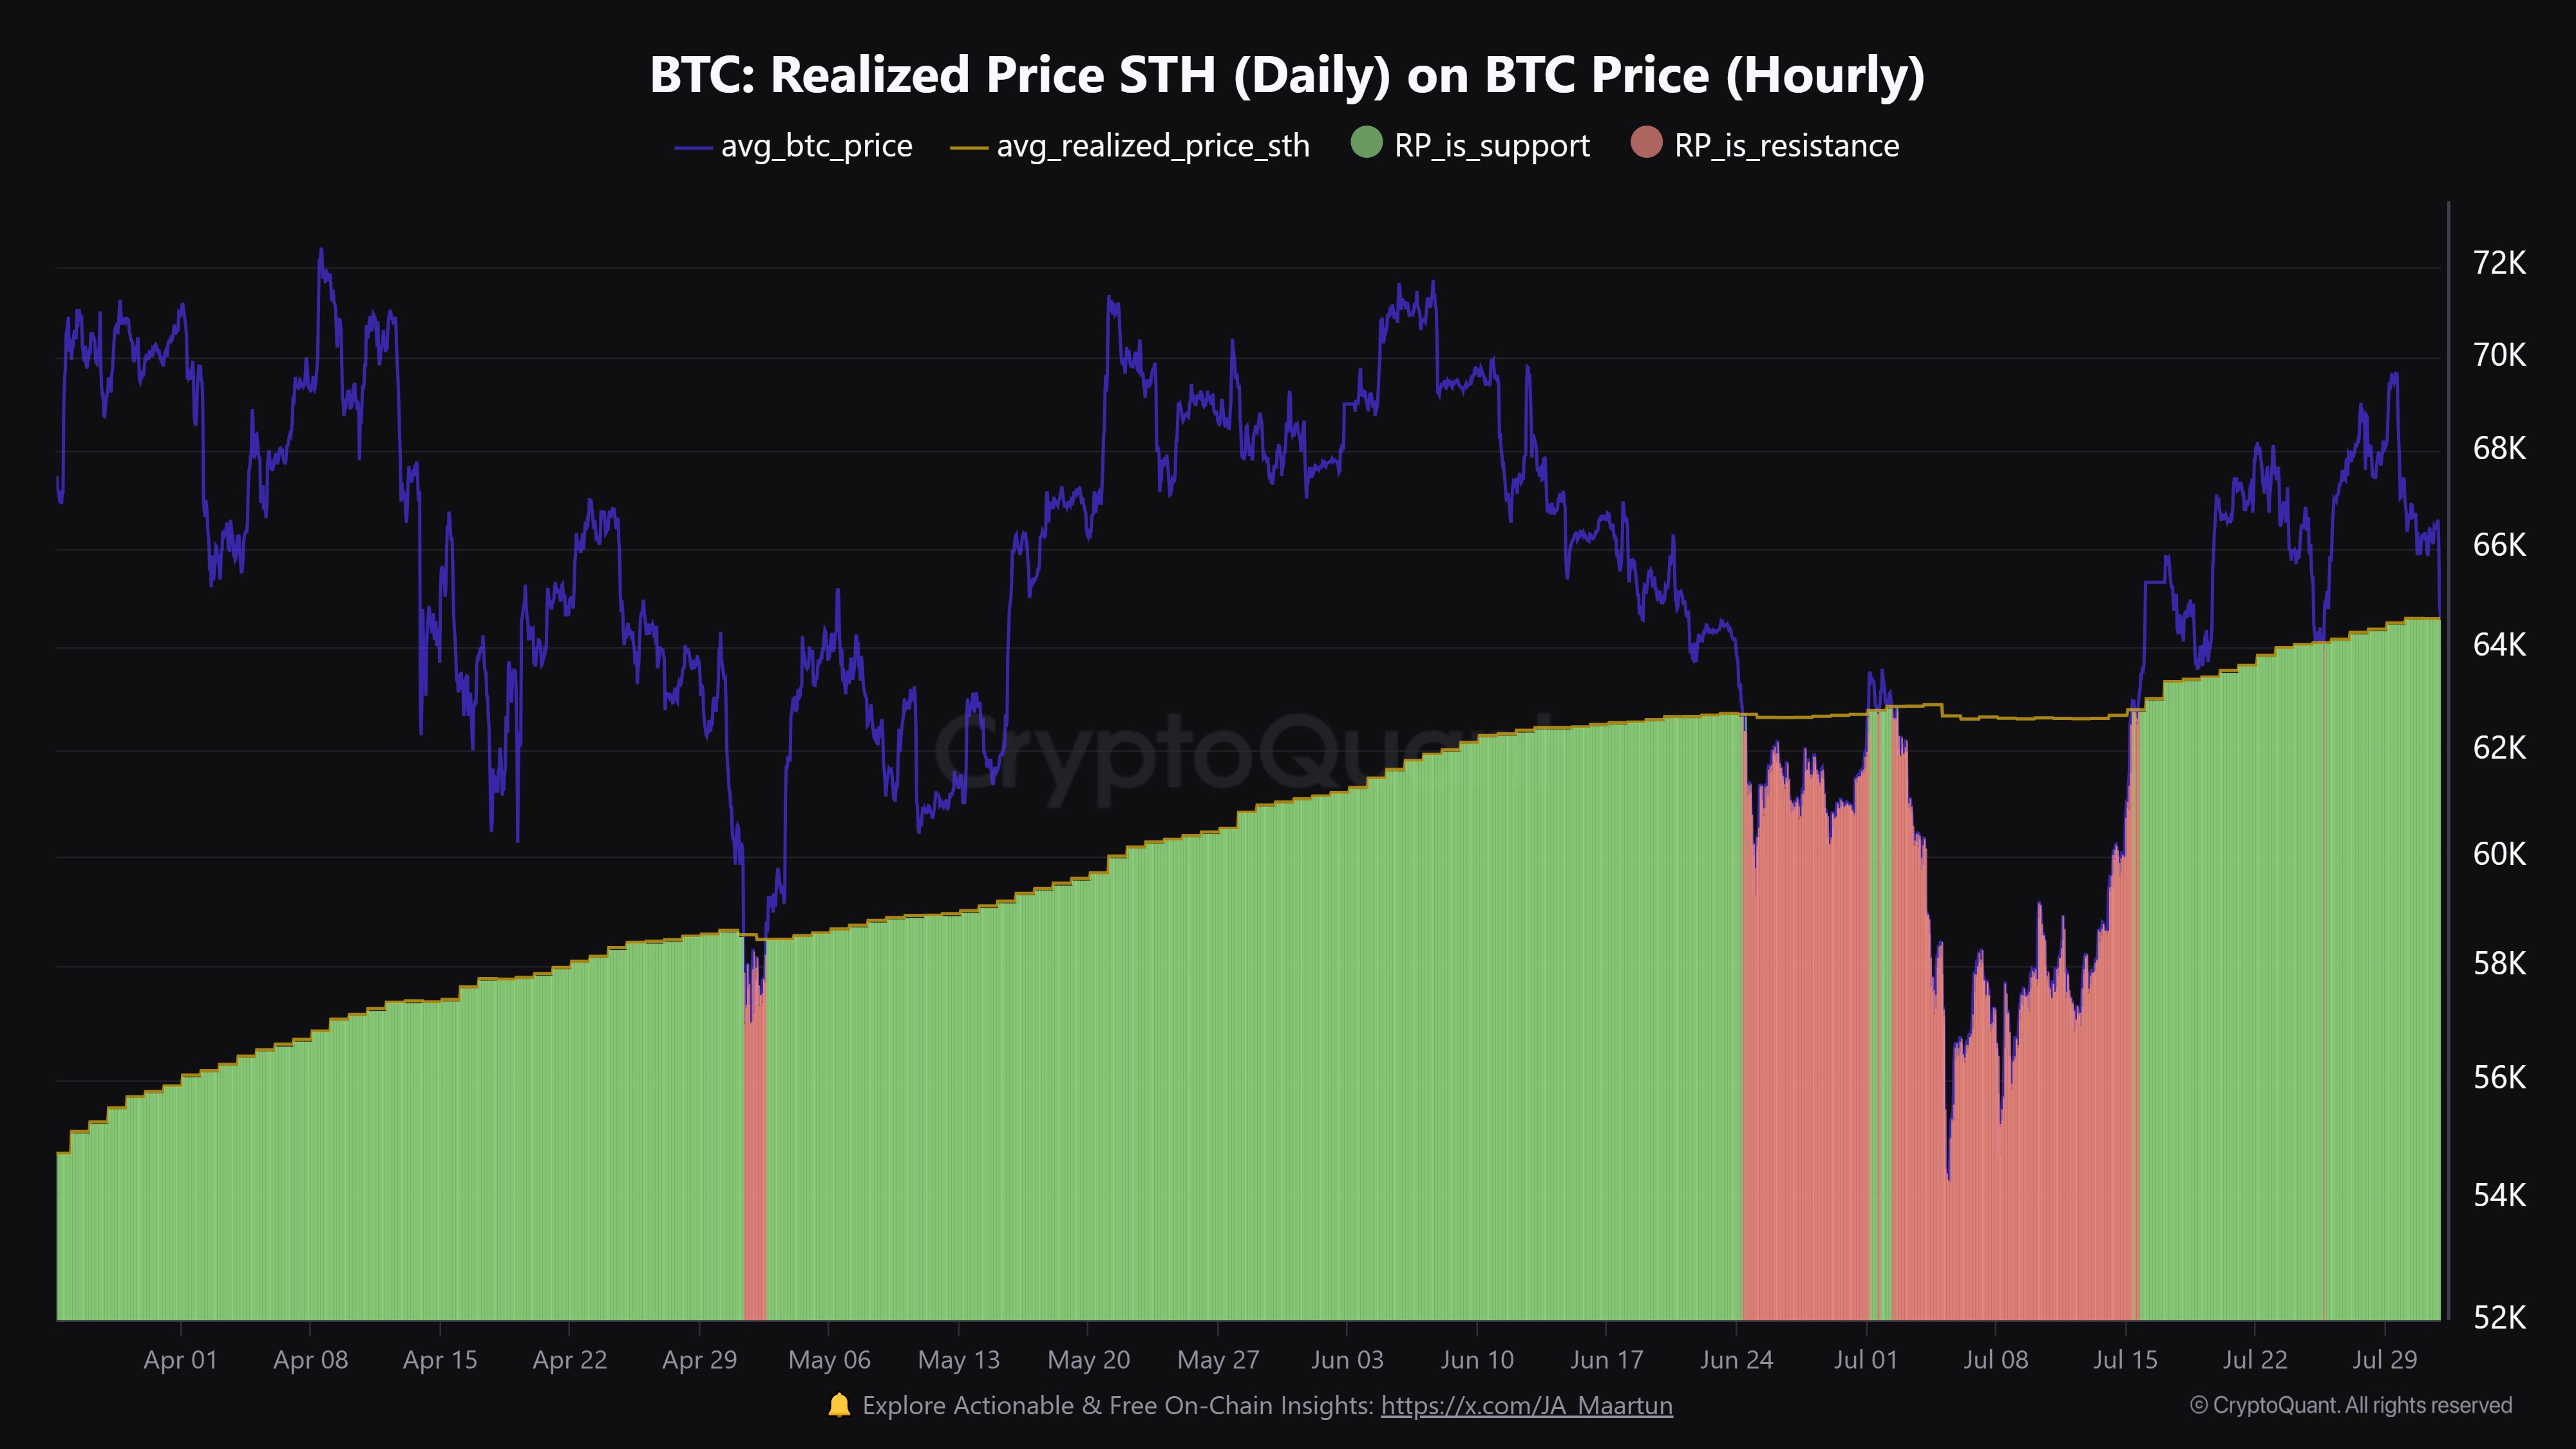
Bitcoin Makes Third Retest Of Historical Support, Analyst Sounds Alarm
An analyst has warned that support levels weaken the more they are retested and Bitcoin is now doing a third consecutive retest of a major such level. Bitcoin Is Again Retesting The Short-Term Holder Realized Price As explained by CryptoQuant community manager Maartunn in a new post on X, BTC’s latest drawdown has led to it doing another retest of the short-term holder Realized Price. дальше »
2024-8-2 22:00 | |
|
|
Can Bitcoin reach $428K? Yes, but on THIS specific condition
Bitcoin's major liquidation levels were $66,700 on the higher side and $65,450 on the lower side. However, historical data suggested that Bitcoin could fall to the $63,000 level. The overallThe post Can Bitcoin reach $428K? Yes, but on THIS specific condition appeared first on AMBCrypto. дальше »
2024-8-1 21:00 | |
|
|
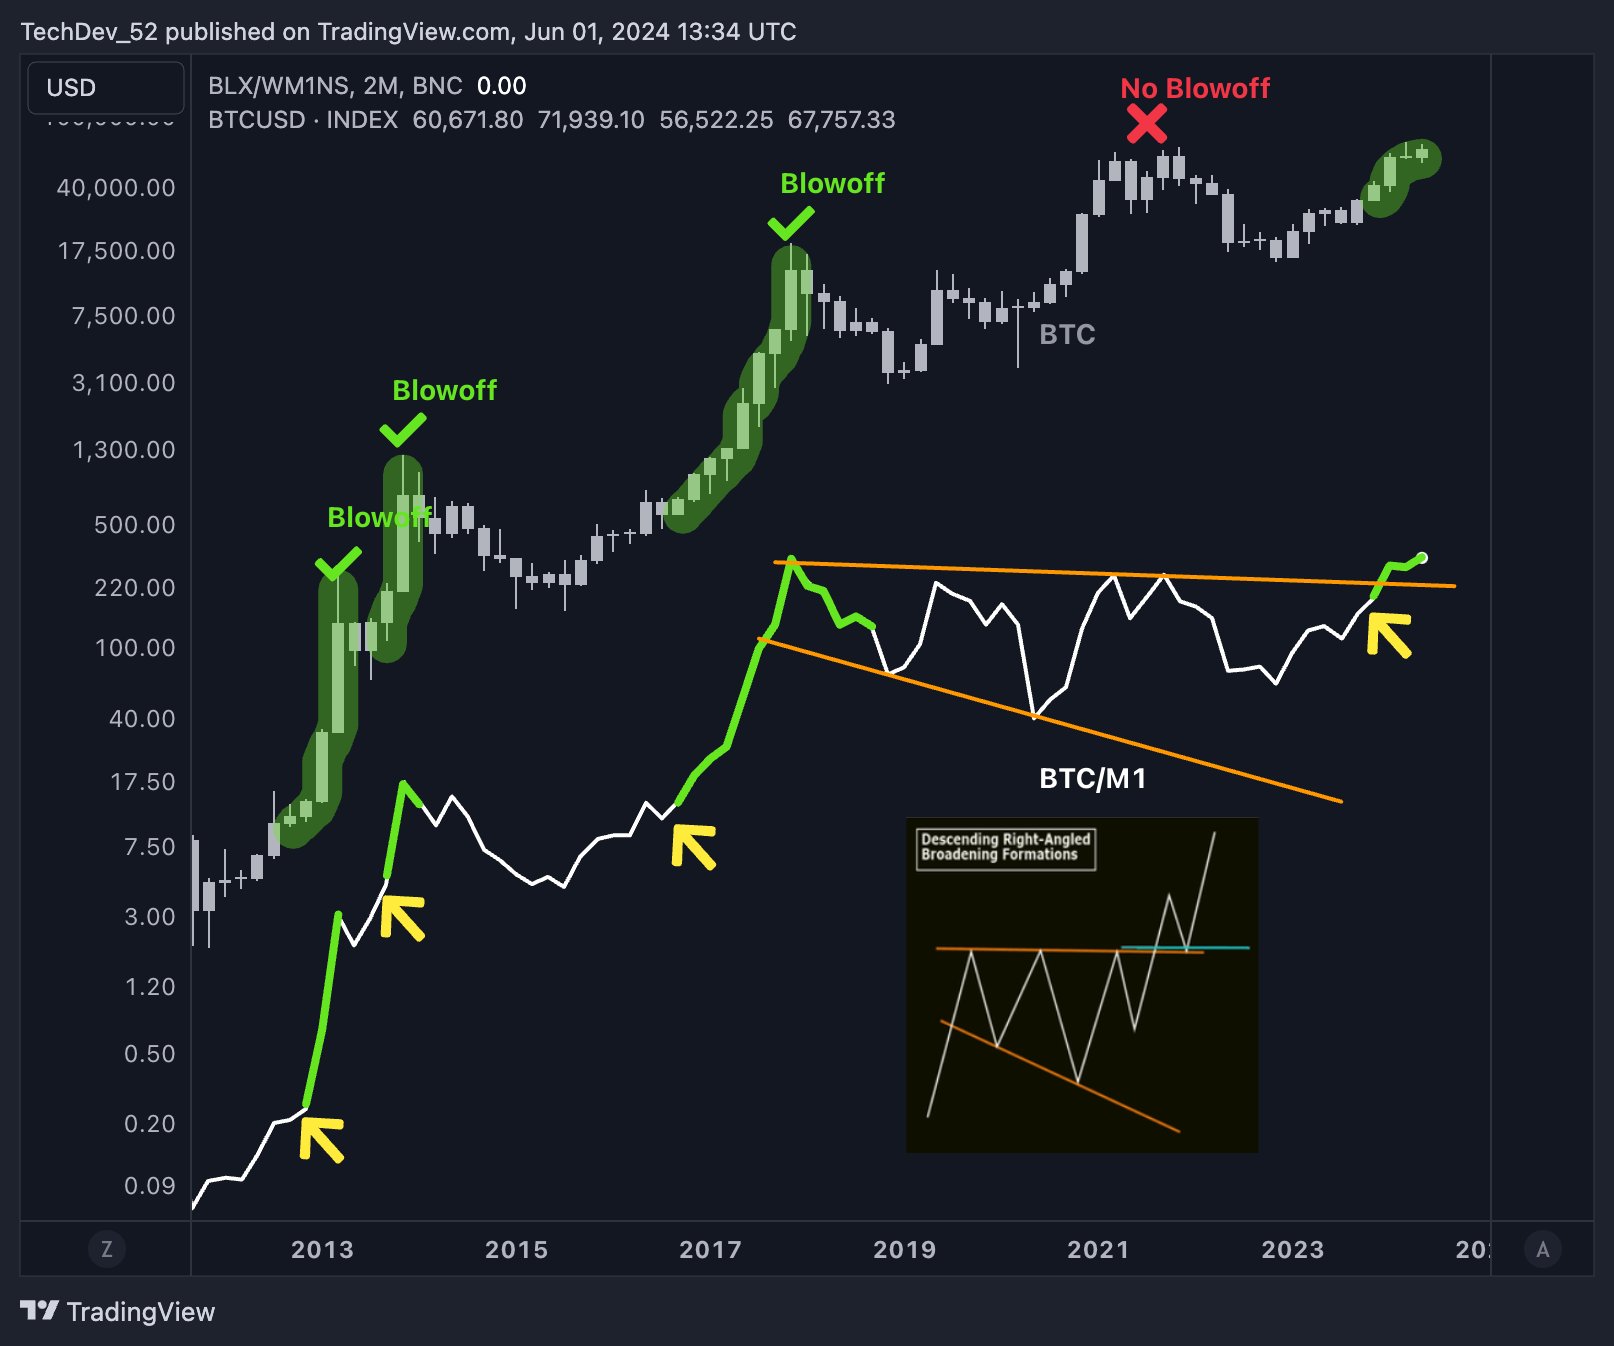
Is This The Biggest Bitcoin Bull Run Ever? Analyst Says Yes!
Crypto analyst TechDev (@TechDev_52) recently shared a detailed chart analysis suggesting that Bitcoin might be on the cusp of its most significant breakout to date. This analysis, backed by historical patterns and technical indicators, points to a potential shift in the market that could lead to unprecedented price levels for Bitcoin. дальше »
2024-6-3 10:50 | |
|
|
Terra LUNA’s LUNC Set To Jump 13x, Analyst Reveals The Drivers
Crypto analyst Javon Marks has laid out a bullish narrative for Terra Classic (LUNC). Based on his analysis, the crypto token could eventually see a 13x increase from its current price levels. The analyst alluded to LUNC’s historical pattern as what could drive such parabolic price surge. дальше »
2024-5-26 15:00 | |
|
|
Timing The Breakout: When Will Bitcoin Escape The Post-Halving Consolidation?
Bitcoin (BTC), the largest cryptocurrency in the market, has been trading within a re-accumulation range between the $59,000 and $70,000 price levels for the past month and a half. Crypto analyst Rekt Capital recently shared its perspective on this phase and its potential duration, drawing from historical patterns and data in a post on social media platform X (formerly Twitter). дальше »
2024-4-28 03:00 | |
|
|
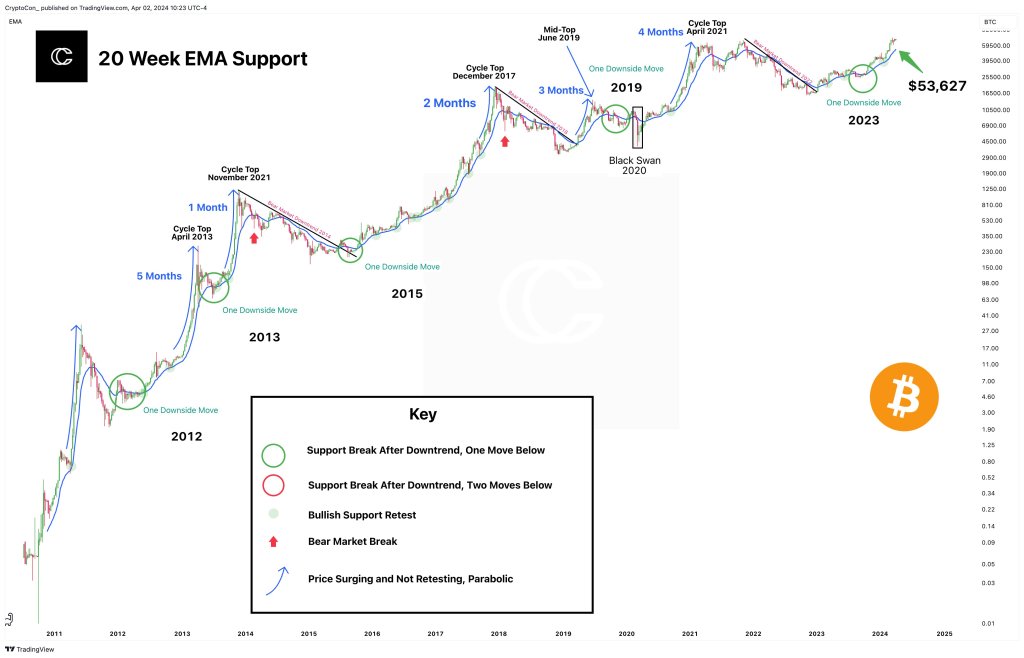
Bitcoin At Crossroads Ahead Of Halving: Will BTC Fall To $53,600?
Bitcoin prices are volatile, recently dropping from the peak of over $73,000 in March to the current spot levels. Analysts are turning to historical data for insights with mounting selling pressure and some investors being concerned about potential short-term losses. дальше »
2024-4-3 19:30 | |
|
|
Dogecoin Open Interest Maintains Record Highs, Is A Crash Coming?
The Dogecoin open interest rose to a new all-time high earlier in March, and while there has been a small retracement, the open interest has continued to maintain very high record levels since then. Given this continuous high level, it could point to where the price of the meme coin is headed next using historical data. дальше »
2024-3-15 01:00 | |
|
|
Bitcoin Supply In Profit Continues Decline, But Still Not At Historical Bottom Zone
Data shows the Bitcoin supply in profit has continued its decline, but the metric has still not reached levels as low as the previous bear market bottoms. Around 50% Of The Bitcoin Supply Is In Profit At The Moment According to the latest weekly report from Glassnode, the current profitability levels in the BTC market are still above the 40%-42% values that were observed during historical bottoms. дальше »
2022-10-12 22:00 | |
|
|
Why Weekly RSI Could Suggest The Bitcoin Bottom Is In
Bitcoin price is currently trading at around $23,500 at the time of this writing, up over 30% from lows and 10% for the week. The recovery has brought the weekly RSI out of oversold territory after reaching historical levels. дальше »
2022-7-20 22:37 | |
|
|

Bitcoin Prices Could Peak at the End of 2022 — BTC Market Cycle Analysis
In today's long-term Bitcoin analysis, BeInCrypto looks at the structure of historical BTC cycles in relation to logarithmic regression bands and macro Fibonacci levels. The post Bitcoin Prices Could Peak at the End of 2022 — BTC Market Cycle Analysis appeared first on BeInCrypto. дальше »
2021-11-23 13:20 | |
|
|
Bitcoin SV, NEM, Maker Price Analysis: 09 February
Despite market leaders Bitcoin and Ethereum valued at historical levels at the time of writing, altcoins such as NEM and Maker moved on their own accord, while trading in the red zone. On the contraryThe post Bitcoin SV, NEM, Maker Price Analysis: 09 February appeared first on AMBCrypto. дальше »
2021-2-9 17:30 | |
|
|


Bitcoin awaits US election results to make a move
Bitcoin is going through high levels of volatility as the US presidential election takes place. While it remains whether the Democratic or Republican party will win, historical data shows that the flagship cryptocurrency may resume its uptrend after Americans are done casting their ballots. дальше »
2020-11-7 14:26 | |
|
|
This Bitcoin metric is reaching its historical reversal levels
Bitcoin and Ethereum have shared the center stage at regular intervals this year. In fact, some would argue that Ethereum has run more miles and gotten more attention than BTC this year. Such a scenarThe post This Bitcoin metric is reaching its historical reversal levels appeared first on AMBCrypto. дальше »
2020-9-24 19:30 | |
|
|

Bitcoin Halving Interest on Google Trends Reaches 4X 2016 Levels
If data from Google search results are anything to go by, the anticipation for the upcoming Bitcoin (BTC) halving event is beginning to reach a fever pitch. Bitcoin’s historical trend has seen the price reach new all-time highs on the back of the previous two halvings. дальше »
2020-5-5 08:15 | |
|
|
Bitcoin Transactions Hit Historical Levels Despite The Virtual Currency’s Unstable Price
For the past few weeks, Bitcoin’s price has been very volatile with the virtual asset trying to find a foothold at the $10,000 zone. It seems its high volatility of recent has done nothing to impact on its adjusted transaction volume which surged over $5 billion on July 30, 2019. дальше »
2019-8-2 19:50 | |
|
|

Bitcoin Price Analysis: BTC Could Drop to $9,000 Soon
Overhead descending resistance forming on Bitcoin could develop a descending channel taking price levels down to $9,000 over the coming week. This would allow for sideways consolidation to take place around $9,000, which is a key historical psychological support/resistance level allowing volume to rush back into the Altcoin market. дальше »
2019-7-1 20:17 | |
|
|
EOS, XLM, ADA, and TRX are showing signs of liftoff
Bitcoin’s surge above $9,000 diverted investor attention away from altcoins with most coins relative to BTC experiencing single-digit losses. This technical analysis will explore whether EOS, Stellar, Cardano, and TRON are preparing for an upswing when interest returns to the market. дальше »
2019-6-18 22:58 | |
|
|
Bitcoin makes new yearly high as it nears $9000
Since February, bitcoin experienced four consecutive months of price increases. BTC has gone up more than 168 percent, marking a new yearly high of $8,950 today. Bitcoin Technical Analysis On the 1-month chart, a series of support and resistance levels based on historical data can be drawn. дальше »
2019-5-27 18:55 | |
|
|
Bitcoin technical analysis, price reaches yearly high as it nears $9000
Since February, bitcoin experienced four consecutive months of price increases. BTC has gone up more than 168 percent, marking a new yearly high of $8,950 today. Bitcoin Technical Analysis On the 1-month chart, a series of support and resistance levels based on historical data can be drawn. дальше »
2019-5-28 18:55 | |
|
|

Bitcoin RSI Remains Overbought, BTC Could See $3,000 If Historical Trend Is Followed
Bitcoin Ready To Dump… Maybe While Bitcoin saw a drawdown from $5,450 to $4,950 on Thursday, BTC’s Relative Strength Index (RSI) reading remains at somewhat overbought levels. HornHairs, an industry analyst, recently drew attention to. дальше »
2019-4-13 10:11 | |
|
|
Ether Price Analysis: Historic Support Tested Amid Signs of Distribution
It’s been weeks since ether has seen a new high or a new low and the market has found itself range-bound. At the moment, we are seeing signs of distribution as large rounds of selling have remained present during key support tests:Figure 1: ETHUSD, 4 Hour Candles, Trading RangeSo far, for the last few weeks, ether has seen a trend of higher lows and low highs (the converging red trendlines). дальше »
2018-10-20 01:31 | |
|
|
Bitcoin (BTC) May Never See $6,000 Again
Chart for BTC/USD (1W) Bitcoin (BTC) is finally out of the woods. The above weekly chart for BTC/USD shows that Bitcoin (BTC) has formed a weekly candle above the historical downtrend line. This is the first time since January 2018 that Bitcoin (BTC) has breached this resistance line and formed a candle above it. дальше »
2018-10-10 00:30 | |
|
|
Bitcoin (BTC) Is Losing Dominance To Rapidly Growing Altcoin Market
Bitcoin (BTC) dominance is on a steady decline. Since the evolution of the altcoin market in 2017, we have seen Bitcoin (BTC) drop from its historical dominance levels towards new lows. The trend is expected to continue for the foreseeable future. дальше »
2018-9-19 17:00 | |
|
|
Ethereum Classic (ETC) Finds Bottom At $10, Forms A Bullish Hammer Reversal Candlestick
Ethereum Classic (ETC) has just formed a bullish hammer candlestick on the daily ETC/USD chart above, which followed by a green candle is a strong sign of a downtrend capitulation as it indicates that the bears have finally given up. дальше »
2018-8-15 18:00 | |
|
|