Новости о Key Chart [ Фото новости ] [ Свежие новости ] | |

Shiba Inu To Rally 100% To $0.000062? Analyst Reveals Why This Is Possible
A crypto analyst has identified a key technical indicator in the Shiba Inu price chart that suggests that the cryptocurrency is set to witness a major price rally to new highs. Asymmetrical Triangle Signaling SHIB Price Surge Appears A crypto analyst identified as Captain Faibik on X (formerly Twitter) has unveiled a distinctive technical pattern in Shiba Inu’s price chart. дальше »
2024-4-3 21:00 | |
|
|
Bitcoin, Ethereum price predictions for this week say...
Bitcoin and Ethereum showcased a bullish market structure on the 12-hour chart. Key retracement levels have been defended thus far, but a retest can't be ruled out yet. Bitcoin [BTC] and EthThe post Bitcoin, Ethereum price predictions for this week say... appeared first on AMBCrypto. дальше »
2024-4-1 18:00 | |
|
|
Dogecoin traders bet big as price hits 3-year high - New predictions?
Dogecoin’s Futures Open Interest has rallied to a new all-time high. Key indicators on a daily chart suggested a further growth in the altcoin’s price. Dogecoin’s [DOGE] Futures Open IThe post Dogecoin traders bet big as price hits 3-year high - New predictions? appeared first on AMBCrypto. дальше »
2024-3-31 05:00 | |
|
|
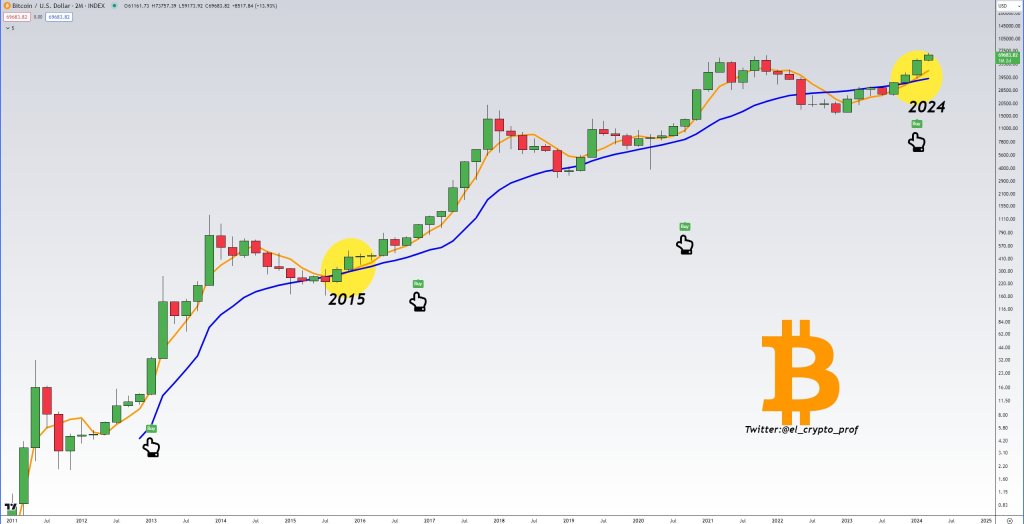
Bitcoin Ready To Rip? Indicator Prints Bullish Signal After 9 Years
One analyst on X thinks Bitcoin bulls may be in for a treat in the coming months after one key indicator printed a buy signal for the first time in nearly a decade. While pointing to a bullish crossover on the 2-month chart’s Golden Moment Indicator, the analyst said the signal is again flashing green in almost nine years. дальше »
2024-3-29 19:00 | |
|
|
PEPE prices drop by 6%, but here's where holders can book some profits
PEPE maintained a bullish structure on the H12 timeframe The key swing points marked on the chart could see PEPE short-term trends reverse Pepe [PEPE] was stuck beneath a lower timeframe resThe post PEPE prices drop by 6%, but here's where holders can book some profits appeared first on AMBCrypto. дальше »
2024-3-29 01:00 | |
|
|
TRON PRICE ANALYSIS & PREDICTION (March 13) – TRX Undergoes Retracement: Targets This Key Trendline For Rebound
Amidst the latest increase across the crypto space, Tron TRX took a bow and continued to retrace downward on the daily chart. It currently appears weak but the trend remains bullish from a long-term perspective. дальше »
2024-3-14 00:16 | |
|
|
Tronix potential short setup as the price drops below a key support level
TRX/USDT chart and technical analysis TRX/USDT yesterday dropped below the key support of 0. 1375 and closed below this level. The recent drop was mainly driven by the massive sell-off after the BTC/USD reached an all-time high. дальше »
2024-3-6 14:29 | |
|
|
BONK PRICE ANALYSIS & PREDICTION (February 29) – Bonk Charges Stronger, Aims To Retake Its ATH Following 100% Surge In A Week
Bonk Inu appeared to be gaining traction again after lifting from a key support level. The price looks strongly bullish on the daily chart, making it the current top crypto gainer with 45% gains in the last 24 hours. дальше »
2024-3-1 00:19 | |
|
|
Shiba Inu (SHIB) Price Skyrockets By 28%: 4 Key Reasons
The price of Shiba Inu (SHIB) has surged by 28% in the last 24 hours and 45% in the last seven days. Today’s surge can be attributed to a confluence of factors, including a rekindling meme coin frenzy, actions by crypto whales, a favorable chart setup, and significant partnerships and ecosystem expansions. дальше »
2024-2-29 19:00 | |
|
|
APECOIN PRICE ANALYSIS & PREDICTION (February 27) – Ape Rejects $2 After Breakout, Can It Sustain Buying Pressure?
Apecoin just broke out to a six-month resistance following a steady rise since the start of the month. It has rejected the $2 level but still sits above key support, forming a bullish pattern on the daily chart. дальше »
2024-2-29 20:36 | |
|
|
As Bitcoin (BTC) Charges On, This AVAX Metric May Signal Price Dips for Altcoins – But There’s a Catch
Cryptocurrency analyst Altcoin Sherpa warned regarding the potential for heavy capitulation across the altcoin market if key support levels fail. AVAX Chart Signals Broad Market Troubles In a tweet post, he highlighted Avalanche’s AVAX token as an important chart to monitor, cautioning that a decisive breakdown could spark a crisis of confidence rippling across cryptos […] The post As Bitcoin (BTC) Charges On, This AVAX Metric May Signal Price Dips for Altcoins – But There’s a Catch appeared first on CaptainAltcoin. дальше »
2024-2-24 23:30 | |
|
|
Top Analyst Reveals PEPE Price Levels to Watch as Bulls Target Over 100% Spike
Popular crypto analyst Ali (@ali_charts) has revealed key price levels to watch for PEPE, as bulls target over a 100% price spike from current levels. Technical Analysis Supports Upside for PEPE According to Ali, PEPE is showing signs of forming the right shoulder of a head-and-shoulders bottoming pattern on its 3-day chart. дальше »
2024-2-24 22:30 | |
|
|
Polkadot (DOT) Bulls Must Defend Key Support Level For Price Recovery, Analyst Warns
Tony Bitcoin, a crypto analyst, warns that Polkadot’s DOT token must hold a key ascending support line to avoid further losses. According to Tony’s chart, DOT has repeatedly bounced off this ascending support over the past few months. дальше »
2024-2-18 13:30 | |
|
|
FLOKI PRICE ANALYSIS & PREDICTION (February 17) – Floki Nears Key Resistance Following An Impressive Recovery In Two Weeks, What’s Next?
Amid the latest surge in volatility, Floki increased by 15% in the past week and now looks bullish on the daily chart. It currently trades near a monthly resistance level as it gathers momentum for a massive move. дальше »
2024-2-18 16:13 | |
|
|
Crypto Expert Forecasts Price Decline for Cardano’s ADA if This Key Resistance Continues to Hold
Popular crypto analyst Rekt Capital posted a technical analysis of Cardano’s (ADA) monthly price chart, warning that ADA could see further downside if it continues to face selling pressure at a key resistance level. дальше »
2024-2-3 23:30 | |
|
|
Chainlink Flashes Bullish “Launch Sequence”: But Can LINK Overcome This Key Resistance?
A notable bull run has propelled the Chainlink (LINK) cryptocurrency to a 16% price increase over the last week. LINK has formed consistent bullish candles within an ascending channel pattern on its daily chart, pointing to growing momentum amongst investors per Coinpedia’s analysis on Trading View. дальше »
2024-2-2 19:30 | |
|
|
As Ethereum predictions turn bullish, what's next for prices?
Ethereum has a bullish structure on the weekly chart. The two key range resistance levels overhead line up well with the liquidation heatmap. Ethereum [ETH] bulls took over a month to breachThe post As Ethereum predictions turn bullish, what's next for prices? appeared first on AMBCrypto. дальше »
2024-1-29 01:30 | |
|
|
Breaking a key resistance indicates the Stacks network is likely on the track of recovery
STX/USDT chart and technical analysis The price of STX/USDT has dropped for the last couple of weeks and lost almost 40% since then. However, recently the price broke the 1.50 key resistance level and created a strong support around the same price, which indicates the return of the bullish trend. The market structure has also […] дальше »
2024-1-29 13:42 | |
|
|
Is Bitcoin Ready To Breakout? Key Metrics Suggest Caution
The Bitcoin price is back above US$20,000 but can this momentum be sustained? Here we examine if recent price history and technical analysis indicate that Bitcoin is truly oversold - and suggest chart patterns to watch for. дальше »
2022-11-3 14:00 | |
|
|
Klaytn (KLAY) Cracks 30% Gains As Price Breaks Downtrend, Is $0.4 Possible?
KLAY’s price shows strength as the price holds strong above the key support zone to avoid price retesting lower point on the daily chart. KLAY rejected to trend higher above $0. 3 as the price faced a sharp rejection to a region of key Support of $0. дальше »
2022-10-26 01:20 | |
|
|
Binance Coin (BNB) Bulls Defends Key Zone, Will The Give Up?
BNB price creates mixed feelings on the high timeframe as price forms a descending triangle on the daily chart while an ascending triangle forms on the weekly chart. BNB looks more stable as the price aims to flip the $340 resistance to set up a bullish sentiment. дальше »
2022-10-3 21:36 | |
|
|
Ethereum Protects $1,200 with Blood, Will This Region Hold?
ETH price holds above $1,200 as bulls don’t want to let go of a price below key support Price continues to trade below 50 and 200 Exponential Moving Average (EMA) on the daily timeframe. ETH price bounced on the four-hourly chart after a bullish divergence appeared. дальше »
2022-9-23 23:31 | |
|
|
Bitcoin reaches this key milestone for the first time since March
Bitcoin [BTC] has made major moves on the price chart after breaking through the $22,000 resistance on the daily chart. As of 12 September, the crypto king breached this zone and has been holding it sThe post Bitcoin reaches this key milestone for the first time since March appeared first on AMBCrypto. дальше »
2022-9-14 22:30 | |
|
|
Litecoin Shows A Bullish Reversal Pattern, Will LTC Price Go To $70?
Litecoin (LTC) has struggled against Tether (USDT) as bulls continue to push the price above the key support region, forming a bullish chart pattern. Bitcoin’s (BTC) price has shown less steam compared to recent times; this has affected most crypto assets, including the price of Litecoin (LTC). дальше »
2022-9-2 19:31 | |
|
|
Cardano Price Trajectory Signals Negative Bearing, Weekly Chart Mostly In Red
The price movement of Cardano (ADA) has been in the negative direction, and the seven-day chart was predominantly red. ADA resistance key seen at the $0. 4694 level Cardano price up by 3. 74% Fed tensions negatively impacted crypto market; including ADA price Following a recent market correction, ADA encountered resistance at the $0. дальше »
2022-8-28 08:50 | |
|
|
Ethereum Price Lost 20% Weekly, What’s The Key Support Now?
Ethereum price has witnessed a tough time lately, the altcoin logged heavy losses over the past one week. Broader market weakness could be blamed for the coin’s current price momentum. Bitcoin slid on its chart and was trading at $21,000 at the time of writing. дальше »
2022-8-23 07:00 | |
|
|
TA – Polkadot Price Shows Strength, Eyes $10
The price of Polkadot (DOT) shows strength after bouncing from key support on the weekly chart against Tether (USDT). After Bitcoin (BTC) bounced from its monthly low of $19,000, this signaled a relief for other crypto altcoins including the price of Polkadot. дальше »
2022-8-5 17:30 | |
|
|


Solana risks 35% price crash with SOL price chart 'megaphone' pattern
Solana market grapples with multiple bearish setups if it breaks below its key 50-week moving average.
дальше »2022-4-10 17:26 | |
|
|
Bitcoin Extends Pullback Toward $37K-$40K Support Zone
Bitcoin (BTC) continues to decline from key resistance levels, indicating a loss of short-term momentum. Support around $37K-$40K remains intact, which could stabilize the down move. On the weekly chart, conditions are still neutral, benefitting short-term trades. дальше »
2022-3-5 22:12 | |
|
|

Bitcoin RSI Looking Incredibly Bullish As BTC Bulls Strive To Reclaim $40k
Key Takeaways Bitcoin RSI points toward an upward rerun. Analyst PlanB brands the move bullish. The metric comes as Bitcoin strives to reclaim $40,000. A look into the BTC chart with the RSI indicator proclaims glad tidings to BTC hodlers in a rather uncertain market. дальше »
2022-2-22 19:46 | |
|
|
Bitcoin Cash traders must watch out for these key levels
Bitcoin Cash presented a symmetrical triangle on its chart and awaited a massive breakout. However, the alt maintained a neutral bias as per its RSI and MACD, so a swing was possible in either directiThe post Bitcoin Cash traders must watch out for these key levels appeared first on AMBCrypto. дальше »
2021-11-2 20:30 | |
|
|
Bitcoin Indicators Point to Possible Inevitable Break Above $40K Resistance
Bitcoin has been rejected several times after a push north of the $40,000 mark. At the time of writing, BTC trades at $36,621 with a 3. 2% profit in the daily and a 31. 9% in the weekly chart. The sentiment is growing bullish, as Bitcoin continues to tackle the important resistance at key levels. дальше »
2021-7-29 21:00 | |
|
|

Bitcoin Selling Pressure is Declining, Hints Key Glassnode Indicator
Even as the bitcoin market shows signs of bullish exhaustion after logging a 1,500-percent-plus upside move in the previous 13 months, all is not lost. Investors with a long-term growth outlook still want to hold onto the flagship digital asset, iterating their expansive bullish stance on it. дальше »
2021-4-9 14:22 | |
|
|

Ethereum Pushes Against Key Resistance as Chart Shows Signs of “Strong Bid”
Ethereum has been largely tracking Bitcoin’s price action as of late, but its swings have been far more tempered as it hovers within the $1,300 region The cryptocurrency has been showing some signs of strength, with bulls ardently absorbing all the intense sell pressure it has faced in recent times This indicates that there’s a […] дальше »
2021-1-31 23:00 | |
|
|
Monero (XMR) Craters 15% Amid Delisting From Leading Exchange
Monero (XMR) is the worst-performing crypto asset of the past 24 hours. The privacy-focused coin is down 15% in the past day, pushing below key support levels amid a strong drop level. Chart of XMR's price action over the past week from TradingView. дальше »
2021-1-2 04:00 | |
|
|
Ethereum Drops Below Crucial Technical Pattern and Must Hold $430
Ethereum could undergo a stronger drop in the days ahead, analysts say, as the cryptocurrency slides below key support levels. Ethereum Loses Key Support Level on a Short-Term Basis: Analysis A crypto-asset analyst shared the chart below just recently, showing how the coin has moved below a rising wedge pattern. дальше »
2020-11-16 02:18 | |
|
|

There’s Millions of Dollars of Ask Orders Suppressing Ethereum Upside
Ethereum has undergone a strong rally over the past few weeks, moving higher with Bitcoin. But key market data suggests that the case for upside will be limited for the time being. For one, there are “monstrous sell walls” on Coinbase for the Ethereum chart. дальше »
2020-11-14 13:00 | |
|
|
Bitcoin “Looks Good” For a Pullback as Price Fails to Pass Key Level
Bitcoin has surged $1,000 from last week’s lows of $10,400. At $11,400, the cryptocurrency remains decisively higher than it was before this rally. Even still, analysts think that Bitcoin is primed to undergo a reversal as its short-term to medium-term chart flashes a number of warning signs. дальше »
2020-10-15 15:00 | |
|
|
Three Key Reasons Why Bitcoin’s Macro Chart Is Still Bullish
Bitcoin has undergone a strong rally over recent months from the March lows to $12,500 at the August highs. Not everyone is convinced that the crypto’s macro trend is positive, though. They point to the fact that Bitcoin has yet to firmly establish itself above $11,500 and $12,000. дальше »
2020-10-13 02:59 | |
|
|

Bitcoin Can “Move Faster” Than Tesla If It Breaks This Key Level: Trader
Unlike Bitcoin, the stock of Tesla (TSLA) has been on a tear over recent weeks and months. Just look at the chart below, which shows that the shares of the world-famous car company have gone parabolic. дальше »
2020-7-20 23:30 | |
|
|
Bitcoin Daily Chart Points A Crucial Breakout Setup With Resistance At $10,000
Bitcoin is trading well above key supports on the daily chart against the US Dollar. BTC seems to be preparing for a crucial bullish breakout above the $10,000 resistance zone. Bitcoin traded as high as $10,390 before it started a minor downside correction. дальше »
2020-6-17 06:58 | |
|
|
Why Bitcoin Breaking Past $9,000 Is Just the Start of a Booming Bull Trend
Since falling as low as $8,180 on Monday, the day of the halving, Bitcoin has mounted a strong comeback. The comeback culminated in a surge past the key $9,000 resistance on Wednesday, seen on the right-hand side of the chart below. дальше »
2020-5-14 22:32 | |
|
|
Ethereum (ETH) Price Analysis (May 13)
• The price is currently recovering and showing positive signs above $185. • Ethereum is well on its way to resistance in the medium-term ETH/USD Medium-term Trend: Bullish Key levels• Resistance levels : $260, $270, $280• Support levels: $85, $75, $65 ETHUSD is in a bullish trend market zone in its medium-term chart outlook.After retesting […] дальше »
2020-5-13 07:34 | |
|
|

Bitcoin Is in “No Man’s Land” After the Halving: Here Are Key Levels to Watch
Since the block reward halving on Monday, the Bitcoin market has entered somewhat of a lull, with the asset trading in the high-$8,000s with little volatility ever since the event. This price action — or lack thereof — has brought the cryptocurrency into “no man’s land,” according to one popular crypto trader pointing to the chart below. дальше »
2020-5-13 04:00 | |
|
|