2022-10-3 21:36 |
BNB price creates mixed feelings on the high timeframe as price forms a descending triangle on the daily chart while an ascending triangle forms on the weekly chart. BNB looks more stable as the price aims to flip the $340 resistance to set up a bullish sentiment.
The price action of the Binance Coin (BNB) continues to look strong despite the price forming a bilateral chart pattern on the daily and weekly timeframe. Surprisingly Bitcoin (BTC) movement in a range has had little effect on the price of Binance Coin (BNB), with BNB creating more hope of a better price moment in October. (Data from Binance)
Binance Coin (BNB) Price Analysis On The Weekly Chart Weekly BNB Price Chart | Source: BNBUSDT On Tradingview.comDespite showing a great price movement in recent weeks as the price rallied to a high of $337 before facing rejection, the price of BNB has handled the rejection pretty well as price bounced from a weekly low of $270 to a region of $283 as price holds up the key region.
The price of BNB retraced to a region of $270 after a rejection that affected the price from trending higher, coupled with the news from Consumer Price Index (CPI) and Federal Open Market Committee (FOMC) having a negative impact. BNB price so far has handled the reactions very well over the weeks, with the price looking more decent in price action.
BNB’s price needs to break and hold above $350 for the price to rally to a higher region with more bullish sentiments.
Weekly resistance for the price of BNB – $337.
Weekly support for the price of BNB – $270.
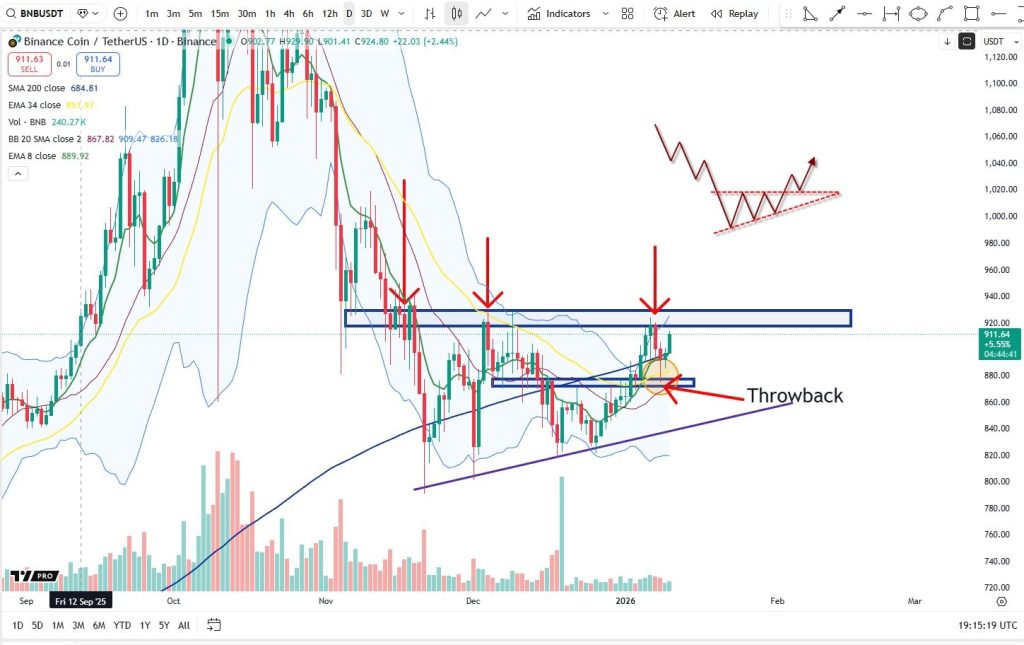
Price Analysis Of BNB On The Daily (1D) Chart Daily BNB Price Chart | Source: BNBUSDT On Tradingview.comIn the daily timeframe, the price of BNB continues to trade below key resistance as the price attempts to break above higher heights, with the price being rejected on several attempts. BNB bulls have had a hard fight trying to defend falling off the $270 region as this price holds the key to a rally in an attempt to break the resistance holding off the price from going higher.
BNB’s price continues to increase as it forms an ascending triangle with a breakout that could signal a relief rally.
The price of BNB trades at $280 above the 50 Exponential Moving Average (EMA). The prices of $282 correspond to the price at 50 EMA for BNB on the daily timeframe.
A break and close above $350 could see the price of BNB assume some bullish sentiment in October as many traders and investors anticipate a green October, which could spell a rally to a region of $400 or higher.
Daily resistance for the BNB price – $300-$340.
Daily support for the BNB price – $270.
Featured Image From Coingape, Charts From Tradingview origin »ETH/LINK Price Action Candlestick Set (LINKETHPA) на Currencies.ru
|
|


