Новости о Indicator Price [ Фото новости ] [ Свежие новости ] | |


Analyst: Buying Next Bitcoin (BTC) Pullback Could Lead to 30% Gains
Following its recent surge, Bitcoin has now found itself caught under $4,000, despite finding stability in the $3,900 region. Analysts are now claiming that BTC’s trading volume will likely be the best indicator as to if the cryptocurrency has enough buying pressure to propel its price above the important psychological price level of $4,000. дальше »
2019-2-22 01:00 | |
|
|
Ethereum Vs Litecoin Price Action – ETH Leads the Way for Top Cryptocurrencies
Litecoin has acted as a leading indicator for other top cryptocurrencies in recent price action trading. However, over the weekend, Ethereum acted as a leading indicator as it broke bullishly from an ascending triangle pattern it had been forming. дальше »
2019-2-18 18:59 | |
|
|
There’s 1 Similarity Among the Best-Performing Cryptos During Brutal 14-Month Bear Market
This week, Ryan Selkis, the founder of Messari, a crypto markets data platform, released the rankings of 25 cryptocurrencies he personally believes have been the most active in making gains. “I made a dashboard of 25 token teams that ship code relentlessly. дальше »
2019-2-15 18:51 | |
|
|
Litecoin [LTC] Price Action – Bearish Divergence Precedes Litecoin Retracement
Litecoin underwent a huge surge last week. Movements in Litecoin preceded bullish movements across the rest of the market with Litecoin often acting as a leading indicator for movements in other top cryptocurrencies. дальше »
2019-2-11 18:49 | |
|
|
NEO Long-term Price Analysis – February 10
NEO/USD Long-term Trend – Ranging Distribution territories: $11, $14, $17 Accumulation territories: $5, $4, $3 Despite a sudden spike in the NEO/USD market valuation on February 8, the crypto still moves around last week’s $8 upper range mark until present. дальше »
2019-2-10 13:07 | |
|
|
Ripple’s XRP Price: XRP Underperforms and Forms Lower High
A surge took place yesterday across the market led by Litecoin. Movements in Llitecoin can often serve as a leading indicator for movements in Bitcoin and other top altcoins, and this was the case yesterday. дальше »
2019-2-9 18:59 | |
|
|
Ethereum Price: ETH Set to Overtake XRP?
The cryptocurrency market spiked yesterday. The increase that took place across the market was led by litecoin which can often be used as a leading indicator for price movements in bitcoin and top altcoins. дальше »
2019-2-9 17:54 | |
|
|
Bitcoin [BTC] Price: Is the Bear Market Over?
The odds that the bear market for cryptocurrencies is over drastically increased yesterday. Litecoin which often acts as a leading indicator for price movements in Bitcoin recorded a double-digit percentage increase in price early in the day and this was followed with increases in bitcoin and to altcoins. дальше »
2019-2-9 17:29 | |
|
|
Bitcoin SV (BSV) Daily Price Forecast – February 7
BSV/USD Medium-term Trend: Ranging Supply zones: $150, $200, $250 Demand zones: $50, $40, $30 BSVUSD returns to a range-bound market in its medium-term outlook. The bulls return was signaled after the formation of a doji a trend reversal indicator at $57. дальше »
2019-2-7 05:21 | |
|
|
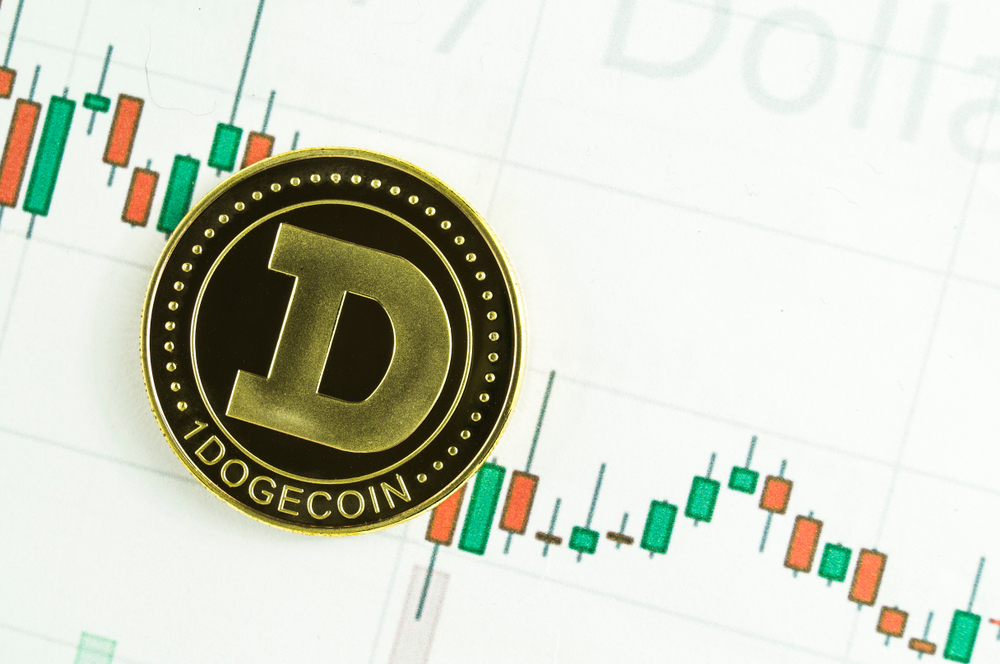
Dogecoin Price Goes Sideways yet Traders Expect Drop to 50 Satoshi
The public’s opinion on Dogecoin is all over the place. Some appreciate the project, whereas others think it shouldn’t even exist in the first place. Regardless of how one feels about it, the Dogecoin price is usually a viable indicator to gauge future cryptocurrency market momentum. дальше »
2019-2-5 17:08 | |
|
|
Binance Coin (BNB) Long-term Price Analysis – January 27
BNB/USD Long-term Trend – Ranging Distribution territories: $9, $10, $11 Accumulation territories: $5, $4, $3 The market valuation of BNB/USD has been relatively consolidating around $7 mark over a week a bit above its 14-day SMA indicator. дальше »
2019-1-27 12:03 | |
|
|

Bitcoin [BTC]’s Price Approaches Oversold Territory, a Short-term Rally Could Be Ahead
According to a new Bloomberg report, technical indicators are showing an upside rally for Bitcoin could be near as the coin appears to have bottomed out. The GTI Global Strength Technical Indicator suggests that the coin is currently near oversold levels, which could signal a good entry point for investors. дальше »
2019-1-23 16:29 | |
|
|
ZCash (ZEC) Long-term Price Analysis – January 20
ZEC/USD Long-term Trend – Ranging Distribution territories: $70, $80, $90 Accumulation territories: $40, $30, $20 ZCash has continued to trade against the US dollar in almost the same manner it did last week. дальше »
2019-1-20 13:35 | |
|
|
NEO Long-term Price Analysis – January 13
NEO/USD Long-term Trend – Ranging Distribution territories: $12, $16, $18 Accumulation territories: $5, $4, $3 Last week, between January 6 and 9, NEO/USD market valuation sequentially featured lower highs to eventually touch $10 mark. дальше »
2019-1-13 13:36 | |
|
|
Tron (TRX)’s Price at Its 200-Day MA as niTROn Event Approaches
Recently Tron’s price crossed and spiked nearly 50% above its 200-day moving average in a strong bullish move. TRX was the only major cryptocurrency to be trading above this long term trend indicator, but with the market taking a bearish turn over the last few days, TRX’s price has now retraced and is resting just above […] Tron (TRX)’s Price at Its 200-Day MA as niTROn Event Approaches was originally found on Cryptocurrency News | Blockchain News | Bitcoin News | blokt.com. дальше »
2019-1-12 23:23 | |
|
|
Technical Indicator Signals That Bitcoin is Gearing Up for a Huge Price Move
For the past several days, Bitcoin bulls have been defending $4,000, which is increasingly becoming a level of support for the cryptocurrency. Despite this, it has not yet built up enough buying pressure to propel its price beyond the low-$4,000 range. дальше »
2019-1-10 04:00 | |
|
|
Bitcoin Could be Nearing Bull Territory as Technical Indicator Turns Positive
Ever since Bitcoin touched the low-$3,000 region in mid-December, its price has been gradually increasing and just yesterday broke above the $4,000 price level for the first time in a couple of weeks. дальше »
2019-1-8 04:00 | |
|
|
Why is Stellar (XLM) having a 10x lower trading volume than Litecoin (LTC)
Trading volume, or volume, is the number of tokens bought and sold that indicates the overall activity of a token for a given period. Trading volume is a useful technical indicator you can use to confirm a trend or trend reversal. дальше »
2019-1-7 01:46 | |
|
|

Upward Momentum Pushes Cardano Price Closer to $0.05
It has been a very interesting day for all cryptocurrencies. Whereas most top markets seemed subjected to bearish pressure, that ship has now turned around again. If the Cardano price is any indicator in this regard, the start of next week will be rather interesting. дальше »
2019-1-7 20:48 | |
|
|
NEO Long-term Price Analysis – January 6
NEO/USD Long-term Trend – Ranging Distribution territories: $12, $16, $18 Accumulation territories: $5, $4, $3 NEO/USD market has been ranked amidst one of the crypto-markets that have been tightly experiencing price range movements along with its 14-day SMA indicator. дальше »
2019-1-6 14:48 | |
|
|

MONERO (XMR) Daily Price Forecast – December 31
XMR/USD Medium-term Trend: Ranging Resistance levels: $52, $56, $60 Support levels: $40, $36, $32 On December 28, XMR/USD lost momentum to sustain past its 50-day SMA’s trend-line. Just about then, the crypto has been majorly experiencing lower lows underneath the indicator’s trend-line. дальше »
2018-12-31 16:57 | |
|
|
Why is Volume an Important Investment Indicator for Crypto Traders Over RSI and Moving Averages?
There are many indicators that professional traders use to operate in the crypto market. When they combine their analysis with indicators, it is possible for them to have better results in predicting price movements or market directions. дальше »
2018-12-24 21:27 | |
|
|
Bitcoin Oversold on Weekly Price Chart for First Time in Four Years
A key long-term bitcoin price indicator is reporting oversold conditions for the first time in almost four years. дальше »
2018-12-11 14:00 | |
|
|
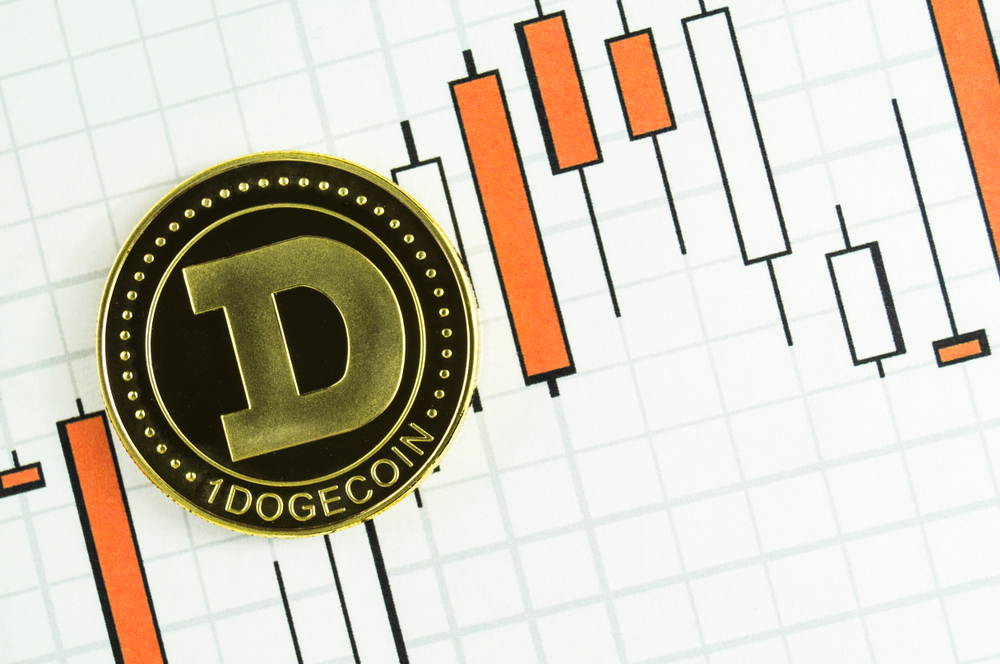
DOGE/BTC Losses Don’t Hinder Dogecoin Price Stability
When it comes to gauging the overall cryptocurrency momentum, Dogecoin has become somewhat of a price indicator. When its value remains stable, Bitcoin is most likely going down. In today’s edition, it seems the Dogecoin price will remain at $0. дальше »
2018-12-10 22:24 | |
|
|
Electroneum added on HitBTC and the price reaction was a ridiculous jump of 38%. This is an indicator of a deeper problem in ETN
Electroneum (ETN) saw a brief, preposterous spike of 38%, as the coin jumped following its listing on the HitBTC exchange. As per the official blog announcement from the exchange: “We are happy to announce the long-awaited integration of Electroneum (ETN), the mobile-based cryptocurrency providing a digital payment solution to the developing world. дальше »
2018-11-22 01:11 | |
|
|
Bitcoin Price Charts ‘Death Cross’ In First Since 2014
Bitcoin’s (BTC) price woes may not be over just yet, as a specific "death cross" indicator is about to reoccur for the first time in four years. дальше »
2018-11-14 15:00 | |
|
|

Key Technical Indicator Shows Bitcoin Price Poised for ‘Santa Claus Rally’
The crypto market continues to endure a difficult 2018 after increasing posting astronomical gains in 2017. However, signs are beginning to emerge that Bitcoin price may set for another rally before 2019. дальше »
2018-11-8 14:00 | |
|
|
Ethereum (ETH) Price Analysis: Despite Constantinople Hard Fork Delay Market Still Bullish
Joseph Lubin is not distracted by falling prices saying it is not a perfect metric to measure the resilience of the market. In his view, the rising number of projects and adoption is a proper indicator of a firm market. дальше »
2018-10-23 15:57 | |
|
|

Report: Despite Price Volatility Blockchain and Crypto Jobs Are In Demand
Glassdoor Economic Research is delivering much needed good news to the crypto community saying that despite extreme price volatility and regulatory uncertainty, the number of crypto jobs in the blockchain and cryptocurrency sector has risen by 300 percent since the same time last year. дальше »
2018-10-19 21:27 | |
|
|
The Fallacy of High Supply, Low Price: Bitcoin Would be SIX TIMES more Valuable than XRP with Same Circulating Supply
Thing is, price is an important asset indicator but more often than not, it’s misleading. It even more flawed in cryptocurrencies where investors and coin enthusiast compare two cryptocurrencies. дальше »
2018-10-13 13:49 | |
|
|

Bitcoin Value Indicator Says Price ‘Still Overbought’ But Bottom ‘Near’
The Bitcoin price bottom is “near,” but the largest cryptocurrency still shows signs of being “overbought,” new research released October 1 claims. Understanding ‘What’s Going On’ In the latest installment of his ‘Bitcoin Value Indicator,’ tech commentator Hans Hauge brought together multiple factors to create an overview of the Bitcoin price which he says allows investors to “understand what’s going on. дальше »
2018-10-3 23:00 | |
|
|
Sign Emerges That Falling Bitcoin Price Just Might Have a Floor
A long-term indicator looks to have been shoring up bitcoin's price over the last four months. дальше »
2018-10-1 14:00 | |
|
|

ReddCoin Price Surges by 16% as ReddID Hype Intensifies
A lot of the cryptocurrency price action tends to take place outside of the market cap top 20. Altcoins often thrive regardless of how Bitcoin is evolving at that time. The ReddCoin price is an interesting indicator in this regard. дальше »
2018-9-30 20:00 | |
|
|
Ethereum (ETH) Defends Ascending Channel, Price Resumes Uptrend
Ethereum (ETH) has successfully defended its ascending channel and now resumed its uptrend. The above hourly chart for ETH/USD shows that Ethereum (ETH) touched the bottom of the ascending channel and bounced back before closing the hourly candle. дальше »
2018-9-25 17:03 | |
|
|
Why Bitcoin (BTC)’s Price Is A False Indicator Of Actual Value
Chart for BTC/USD (1W) Bitcoin (BTC) is currently trading just above $6,400. The average cost for mining one Bitcoin (BTC) lies slightly below this level between $5,800 and $6,200. This is the reason the price has managed to stay above those levels for now despite the fact that the volume is so low that a couple of million dollars could swing the price either way. дальше »
2018-9-20 17:00 | |
|
|

CNBC ‘Reverse Bitcoin Price Indicator’ Hits Bullseye Again
Less than a week after CNBC forecast an $8000 Bitcoin price, the largest cryptocurrency tumbled close to $6000, leading to ridicule from commentators. ‘$8K Could Be Next’ In another instance of the network proving itself as a so-called ‘reverse price indicator,’ its predictions for BTC/USD completely contrasted with short-term reality, the pair going on to lose almost 13 percent in less than 24 hours. дальше »
2018-9-6 15:00 | |
|
|
Bitcoin Price Indicator Turns Bullish for First Time in 8 Months
Bitcoin's weekly MACD indicator has risen above zero for the first time since January, confirming a long-term bearish-to-bullish trend change. дальше »
2018-9-5 14:05 | |
|
|
Ripple (XRP) Is About To Begin A New Cycle, But Can It Make Similar Gains?
Ripple (XRP) is about to begin a new trend. The weekly chart for XRP/USD shows that this could be as soon as next week when Ripple (XRP) forms a new candle outside the bullish gartley formation on the XRP/USD chart. дальше »
2018-9-3 00:30 | |
|
|

Is Mining Cost the Best Indicator for Determining Bitcoin Price Trends?
Bitcoin mining cost has been a good but cliched indicator for crypto market trends. However, the costs are based on a plethora of internal and external factors that may make them less reliable. Could there then be a way in which mining costs become the most reliable method of determining crypto prices? Medium user BarclayJames makes […] Is Mining Cost the Best Indicator for Determining Bitcoin Price Trends? was originally found on [blokt] - Blockchain, Bitcoin & Cryptocurrency News. дальше »
2018-8-28 17:38 | |
|
|
Bearish Outlook for Price of Bitcoin With Head & Shoulders Pattern Forming?
Last week was a bullish week for Bitcoin as both price and RSI continued to form higher highs and higher lows. The MACD is currently fast approaching a centerline crossover which will be a strong bullish indicator. дальше »
2018-8-28 17:27 | |
|
|

CNBC Tweets Have Been a Contrarian Bitcoin Price Indicator With 95% Accuracy
According to research from prominent cryptocurrency trader Jacob Canfield, who plotted out his findings against a BTC price chart on the popular charting site TradingView, CNBC’s tweets can be used as a contrarian Bitcoin price indicator with as much as 95% accuracy. дальше »
2018-8-25 17:00 | |
|
|

CNBC as Reverse Indicator of Bitcoin Price ’95 Percent Accurate’
Mainstream media network CNBC has become an unlikely Bitcoin hero this week after an analyst showed its bull and bear forecasts were, in fact, signs the cryptocurrency would do the opposite. Bulls, Bears, And CNBC In a submission on TradingView, Jacob Canfield noted how various tweets from CNBC about Bitcoin going higher or lower coincided with abrupt U-turns in the cryptocurrency’s price direction. дальше »
2018-8-25 01:00 | |
|
|
VeChain (VEN) Recovery In Motion As Price Escapes Falling Wedge, Descending Channel Remains Intact
VeChain (VEN) has just broken out of a falling wedge against the US Dollar as can be seen on the VEN/USD daily chat above. The price has yet to test the bottom of the descending channel it has been trading in since the beginning of the year. дальше »
2018-8-24 17:00 | |
|
|

Bitcoin Selloff Could be Over, Says this Technical Indicator
The massive Bitcoin selloff that has characterized most of the market in 2018 might soon be at an end based on the data from a technical indicator. If correct, the top-ranked cryptocurrency may experience a substantial price rally in the last quarter of the year. дальше »
2018-8-24 19:10 | |
|
|