Новости о Consolidation Red [ Фото новости ] [ Свежие новости ] | |

Bitcoin to Follow the Equities Market Up or Down? One-Month Correlation Spikes to an All-Time High
Yet another week of weak price movement. The world’s leading digital asset is trading at $9,072, in red with 24 hours ‘real’ volume of just $624 million. Consolidation precedes more consolidation. $BTC pic. дальше »
2020-7-5 16:25 | |
|
|
Litecoin Hits 13 Month High as Halving Fomo Mounts, Where Next For LTC?
Crypto markets in general have been in consolidation for over a week, largely waiting for Bitcoin to make its next move. Litecoin, however, has not been waiting around as it continues to surge hitting a new high for over a year. дальше »
2019-6-12 11:30 | |
|
|
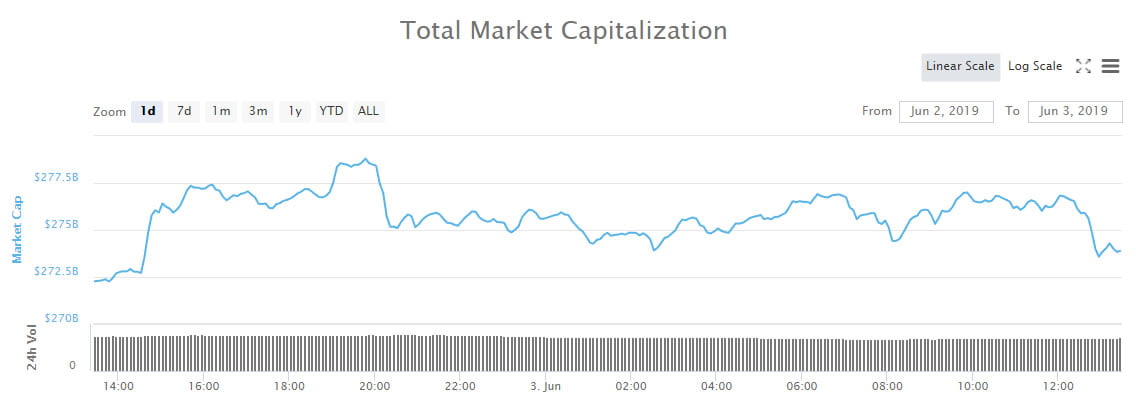
Binance Barely Suffers While Other Cryptos See Red
The cryptocurrency markets have seen a brief period of consolidation after the recent Bitcoin pullback from the $8,000 level,… The post Binance Barely Suffers While Other Cryptos See Red appeared first on Invest In Blockchain. дальше »
2019-5-24 22:47 | |
|
|

Bitcoin Price Analysis: Could Three Times Be the Charm for This Resistance Level?
Bitcoin remains in its tightly coiled range as the market continues its sideways trend for the third week in a row. While macro support has been tested three times recently, we have yet to test the overhanging macro resistance:Figure 1: BTC-USD, Daily Candles, Narrow RangeThe blue zone outlined above shows a very strong zone of support that, over the last few weeks, has seen three strong tests and has led to a slowly upward-drifting market consolidation. дальше »
2019-3-16 01:56 | |
|
|
Bitcoin Price Analysis: New High Paves Potential Reversal Setup
After days and days of consolidation, bitcoin finally managed to break a new high for the first time in almost two weeks. This new high, so far, has been short lived, however, as it was almost immediately sold into by eager bears:Figure 1: BTC-USD, 4-Hour Candles, New HighOur current 4-hour candle is seeing a relatively easy retracement after days and days of an upward grind. дальше »
2019-3-9 02:08 | |
|
|
Bitcoin Price Analysis: Short-Term Support Breaks on High Volume and Spread
Leading into the London open, bitcoin broke through its local support level in a move that seems to be hinting toward a downward continuation:Figure 1: BTC-USD, Daily Candles, Broken Local SupportSo far, our daily candle has yet to close, but it is currently on schedule to close below local support. дальше »
2019-3-5 02:43 | |
|
|
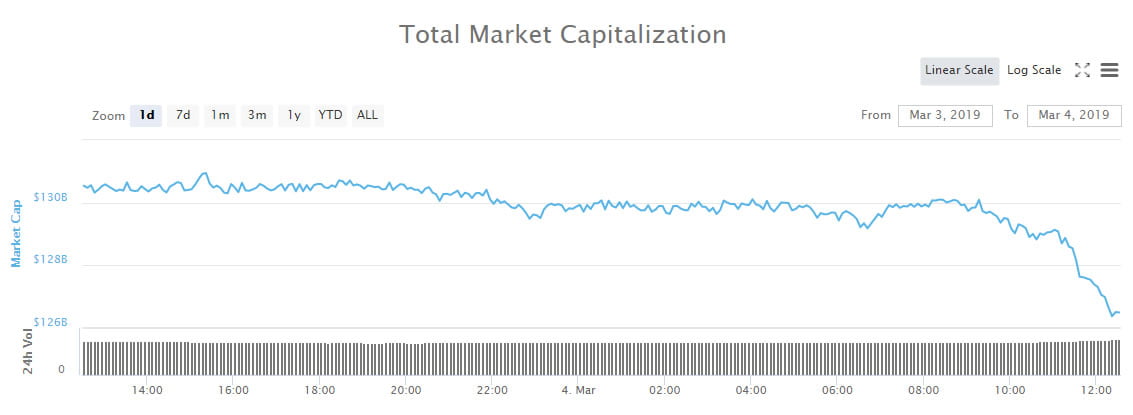
Crypto Market Wrap: Monday Starts With Another Dump in $4 Billion Slide
Crypto markets have just started to slide; Ethereum, Bitcoin Cash, EOS and IOTA getting hurt, Ravencoin flying high. Market Wrap It looks like a Monday morning crypto market dump has just been ignited. дальше »
2019-3-4 09:30 | |
|
|
Bitcoin Price Analysis: Bullish Setups Could Break Current Market Structure
The cryptomarket remains coiled as we lead into the weekend with no new highs and no new lows being established for bitcoin. However, it is nicely consolidating on lower time frames and hints toward the possibility of another leg up:Figure 1: BTC-USD, Hourly Candles, Consolidating PennantThe pattern shown in Figure 1 outlines a potential continuation pattern called a “bullish pennant. дальше »
2019-2-23 02:23 | |
|
|
Bitcoin Price Analysis: Consolidation Breaks Out Into Macro Resistance Test
Over the course of the last 10 days, bitcoin has managed to rally nearly 20% in value as it burst through two major resistance levels and is now beginning the test of a major macro level:Figure 1: BTC-USD, Daily Candles, Macro ResistanceWe can see a clear, descending supply-and-demand channel that governed the market for the last two months. дальше »
2019-2-20 01:38 | |
|
|

Bitcoin Price Analysis: Another Red Day Pushes BTC Into Deeper Support Test
Bitcoin has tumbled again today as the market continues to see further downward movement shortly after breaking two areas of market support. So far, bitcoin is down 15% on the day — 25% in 1 week:Figure 1: BTC-USD, Daily Candles, Downward ContinuationThis drop below support is starting to display hallmarks of market capitulation. дальше »
2018-11-20 02:27 | |
|
|
Bitcoin Price Analysis: Yearly Support Breaks as Bitcoin Tests Underlying Demand
After months and months of consolidation, the yearly support finally broke and now bitcoin has found itself in the lower $5000s for the first time since 2017:Figure 1: BTC-USD, Daily Candles, Broken SupportBitcoin managed to drop a staggering 16% yesterday as the market sliced through the long held support like a knife through butter. дальше »
2018-11-16 01:28 | |
|
|
Ether Price Analysis: Historic Support Tested Amid Signs of Distribution
It’s been weeks since ether has seen a new high or a new low and the market has found itself range-bound. At the moment, we are seeing signs of distribution as large rounds of selling have remained present during key support tests:Figure 1: ETHUSD, 4 Hour Candles, Trading RangeSo far, for the last few weeks, ether has seen a trend of higher lows and low highs (the converging red trendlines). дальше »
2018-10-20 01:31 | |
|
|

Bitcoin Price Analysis: Breakdown of Consolidation Tests Bullish Resolve
In the previous BTC-USD market analysis, we discussed a macro pattern forming, called a “symmetrical triangle. ” A symmetrical triangle (shown in red) is a directionally agnostic consolidation pattern. дальше »
2018-6-13 00:05 | |
|
|