Новости о Channel Chart [ Фото новости ] [ Свежие новости ] | |

Bitcoin (BTC) Price Must Close Above Crucial Support This Week or Risk Another Decline to $55k
Rekt Capital released an analysis of the current price action of Bitcoin (BTC). The weekly timeframe chart reveals a descending channel, characterized by black lines. The upper boundary of this channel has consistently acted as a resistance zone, as indicated by red circles on the chart. дальше »
2024-10-24 22:00 | |
|
|
XRP Price Analysis: Ripple Analyst Shares Key Levels and Price Targets to Watch
EGRAG CRYPTO, a top analyst, shared an analysis of XRP’s monthly price chart, emphasizing key price levels and potential cycle targets for the token. His chart, which he refers to as “Channel B,” has been a major obstacle for XRP, blocking sustained price movement beyond certain levels for years. дальше »
2024-10-17 22:30 | |
|
|
Here’s Why Injective (INJ) Price Could Rally to $52
Crypto analyst Crypto Winkle has shared a bullish outlook for Injective (INJ), with his chart showing a potential price rally to $52. The analysis comes as INJ breaks out of a descending channel and Upbit, South Korea’s largest crypto exchange, integrates the token. дальше »
2024-10-17 20:30 | |
|
|
Dogwifhat Finally Breaks Out: WIF Price Chart Shows Potential 150% Move
Dogwifhat (WIF) has been on the move after breaking out of a six-month descending channel, signaling a potential shift in momentum. According to crypto analyst Captain Faibik, this breakout could pave the way for a price surge, with projections indicating a possible 150% move. дальше »
2024-10-9 21:30 | |
|
|
PEPE Price Pumps 30%, But Which Meme Coin is Best to Invest In Now?
The PEPE price pumped over 30% last week, pushing the token’s value above the $0. 00001 level. Looking at PEPE’s chart, we can see some interesting developments. The token recently broke out of a downward channel pattern, surpassing both the $0. дальше »
2024-9-30 22:30 | |
|
|
Chart of the day: POPCAT traders beware — the worst is yet to come
In just 10 days, POPCAT has dropped over 30%, but the decline may not be over. A deeper analysis of multiple indicators reveals that further declines could be on the horizon. Inside POPCAT’s parallel channel POPCAT respects a parallel channel… дальше »
2024-9-5 12:33 | |
|
|
Is Dogecoin Dead? This Sign Suggests a Potential DOGE Price Rebound Is On The Horizon
Dogecoin’s $DOGE spent most of August in a narrow $0.10 channel, but in the last week, a breakout was attempted, and it rose by 8.5% to a $0.114 peak. Yesterday, Twitter analyst Ali Charts told and shared a chart with his 70k followers that Dogecoin’s price shows a bullish divergence against the Relative Strength Indicator […] The post Is Dogecoin Dead? This Sign Suggests a Potential DOGE Price Rebound Is On The Horizon appeared first on CaptainAltcoin. дальше »
2024-9-3 09:25 | |
|
|
Bittensor (TAO) Signals Bull Run, Eyes $360 For Further Gains
Crypto analyst Ghost has illuminated a breakout in the Bittensor (TAO) chart. TAO has successfully exited a downward channel, marking a bullish departure from previous trends. This development suggests a potential end to its preceding downtrend, offering a reversal outlook that’s catching the eyes of market watchers. дальше »
2024-8-30 22:30 | |
|
|
Expert Predicts Arbitrum’s (ARB) 2x Bullish Rally, Shares Timeline
Arbitrum (ARB) is showing signs of a potential breakout, according to the latest analysis by top crypto analyst Captain Faibik. In a tweet, Captain Faibik shared his insights on the ARB chart, highlighting a descending channel pattern. дальше »
2024-8-26 16:45 | |
|
|
Ethereum's price rally: What makes THIS level a make-or-break point
Ethereum chalked out a classic descending channel pattern on the daily chart, confirming a bearish edge. The immediate support range at the $3,200 level can determine ETH's near-term trajectoryThe post Ethereum's price rally: What makes THIS level a make-or-break point appeared first on AMBCrypto. дальше »
2024-6-25 21:30 | |
|
|
Little-Known But Important Dogecoin Indicator Goes Off, How High Can It Drive Price?
The Dogecoin price slump might be over very soon, according to a little-known but important indicator called the Gaussian Channel (GC). As recently noted by a crypto analyst known pseudonymously as Trader Tardigrade, the Gaussian Channel recently flashed green on the DOGE weekly chart, suggesting the crypto could surge to the upside for the next wave. дальше »
2024-6-23 00:00 | |
|
|
Shiba Inu [SHIB] could rally 20%, but only on THIS condition
An analyst spotted a descending channel on Shiba Inu's price chart, suggesting a 20% rally. Many SHIB tokens were taken off exchanges, reinforcing the prediction. According to Ali Martinez, The post Shiba Inu [SHIB] could rally 20%, but only on THIS condition appeared first on AMBCrypto. дальше »
2024-5-15 19:00 | |
|
|
Cardano Update: ADA Faces Make-Or-Break Price Level For Bullish Revival
The Cardano (ADA) price is down 46% since its yearly high and is currently facing a make-or-break price level for a bullish reversal. Here’s what you need to know: Cardano Price Analysis: Daily Chart The daily ADA/USD chart is currently charting a path within a descending channel, which has defined the bearish trend since the beginning of March. дальше »
2024-5-8 15:30 | |
|
|

Ripple Analyst Predicts $5.85 XRP as Next Target in Ongoing Bull Run – But There’s a Catch
XRP price has remained relatively flat this week, down a modest 1% to trade around $0. 54. Technical analysis shows that XRP recently broke out of a descending channel it had been stuck in since late November, marked by the blue lines on the price chart. дальше »
2024-2-23 21:00 | |
|
|
Chainlink Flashes Bullish “Launch Sequence”: But Can LINK Overcome This Key Resistance?
A notable bull run has propelled the Chainlink (LINK) cryptocurrency to a 16% price increase over the last week. LINK has formed consistent bullish candles within an ascending channel pattern on its daily chart, pointing to growing momentum amongst investors per Coinpedia’s analysis on Trading View. дальше »
2024-2-2 19:30 | |
|
|
Chainlink Price Above $8, Can It Go Past Its Immediate Resistance?
Chainlink price has been trading in an upside channel over the past few trading sessions. The altcoin has managed to move past the $8 level, it is now eyeing the next important resistance mark. The technical outlook of the coin has turned positive as buying strength increased on the chart. дальше »
2022-8-10 04:00 | |
|
|
Stellar (XLM) Broke Down From The Descending Triangle, Fresh Lows On Chart?
Stellar (XLM) picked up pace on the daily chart as the coin registered some upward movement. The coin has been trading within a descending channel. Although the coin was moving sideways, if bulls reclaim the chart XLM can break above the channel. дальше »
2022-7-16 07:00 | |
|
|
Cardano: A close below this mark would bolster a further pullback
Cardano (ADA) has been on a near-term downtrend after recently breaking down from the ascending channel on its 4-hour chart. Meanwhile, it found a base at its vital $1.02-support. If the 20 EMA (reThe post Cardano: A close below this mark would bolster a further pullback appeared first on AMBCrypto. дальше »
2022-4-11 21:30 | |
|
|

Bitcoin (BTC) Bounces Back, Aiming for Higher Prices
Bitcoin is expected to break out from the current short-term descending parallel channel. A short-term decrease could transpire prior to the breakout. Weekly Outlook for BTC The weekly chart shows that BTC created a hanging man candlestick last week. дальше »
2021-3-29 11:01 | |
|
|
EOS, Basic Attention Token, Maker Price Analysis: 19 January
EOS eyed a breakout from its press time channel to touch the $2.91-resistance level. BAT formed an ascending triangle on the chart and a northbound breakout can be seen over the coming days. Finally, The post EOS, Basic Attention Token, Maker Price Analysis: 19 January appeared first on AMBCrypto. дальше »
2021-1-20 21:00 | |
|
|
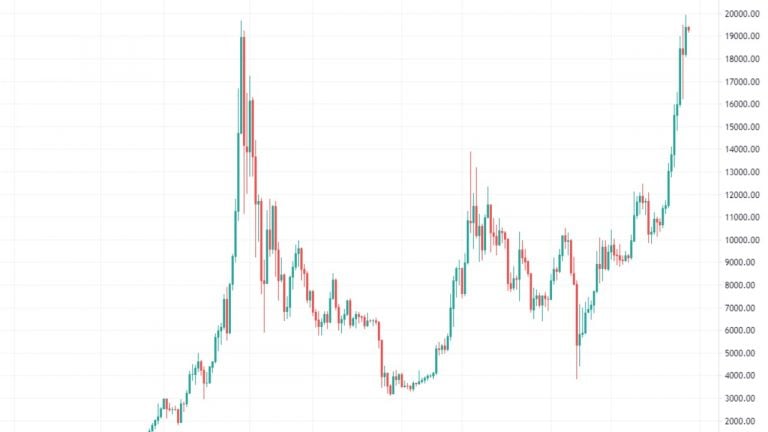
Market Watch by Fyookball: Price Is in a Tight Channel
BTC is often a good macro indicator for the entire crypto market, so this is a good place to start. Bitcoin (BTC) has recently surpassed its all-time high price just shy of $20,000, so it’s a unique time to zoom out and look at the weekly chart for the past several years. дальше »
2020-12-7 15:30 | |
|
|
Ethereum price hits $600 for the first time in two years
Ethereum just hit $600 on most exchanges, peaking at $609. 97 on Coinbase. The digital asset has been trading inside a massive uptrend for the past several days after a breakout from an ascending parallel channel on the 4-hour chart. дальше »
2020-11-24 11:26 | |
|
|
Bitcoin Reaches Highest Weekly Close in Nearly Three Years
During the week of Oct 19-26, Bitcoin (BTC) reached a close above $13,000. While the long-term trend is bullish, the short-term chart has begun to show weakness. Whether the price breaks out or down from the current parallel channel will likely determine the direction of the short-term movement. дальше »
2020-10-26 13:25 | |
|
|

Why this pundit expects November to be huge for Bitcoin, projects price at over $20k
The short-term for Bitcoin is looking quite bearish as bulls have lost the $9,000 level and the daily ascending channel. Bitcoin is currently trading at $8,764 as bulls keep losing strength. Not everything is lost for them but it’s clear the short-term is shifting in favor of the bears. The daily chart can still be […] дальше »
2020-5-26 12:23 | |
|
|
Tezos Outperforms Bitcoin, Gears Up For An Extended Uptrend
The digital asset managed to break above the shrinking ascending channel on the daily chart after breaking $2. 39. XTZ is currently trading at $2. 68 but managed to touch $2. 755 after an extended daily uptrend. дальше »
2020-4-25 20:25 | |
|
|
Cardano (ADA) Retests Key Retracement Level, Still Bullish Long-Term
The cryptocurrency market has been bleeding quite hard for the past week and Cardano hasn’t been an exception. The digital asset plunged down to $0. 05623 today, a key level set by the lower line of the expanding upwards channel formed on the daily chart. дальше »
2020-2-26 23:22 | |
|
|
Bitcoin Price & Time: Bulls Aiming $7.8K and $8K
After a downside correction, bitcoin price found support near $6,860 against the US Dollar. The price is currently rising and trading nicely above the $7,400 resistance. There was a break above a major declining channel with resistance near $7,345 on the 4-hours chart of the BTC/USD pair (data feed from Kraken). дальше »
2020-1-5 08:00 | |
|
|
Ethereum Overwhelmingly Bullish And $145 Is Imminent, Here’s Why
ETH price is gaining bullish momentum above the $132 resistance against the US Dollar. The price is trading above $135 and it recently traded to a new 2020 high. There was a break above a key declining channel or bullish flag with resistance near $130 on the 4-hours chart of ETH/USD (data feed via Kraken).... The post appeared first on NewsBTC. дальше »
2020-1-5 07:08 | |
|
|
Bitcoin Bears Rejected $7,300, Price Vulnerable Below $7K
Bitcoin was rejected on a few occasions near $7,260 and $7,300 against the US Dollar. The price is currently declining and it remains at a risk of more downsides below $7,000. There is a declining channel forming with resistance near $7,180 on the hourly chart of the BTC/USD pair (data feed from Kraken). дальше »
2020-1-2 08:28 | |
|
|
Ethereum (ETH) Shows Signs of Important Reversal, $150 Imminent?
Ethereum is climbing higher and trading nicely above the $130 level against the US Dollar. The price is likely to continue higher once it surges above the $150 resistance. There is a rising channel forming with support near $133 on the hourly chart of ETH/USD (data feed via Kraken). дальше »
2019-12-23 06:14 | |
|
|
Bitcoin (BTC) Flirts With Key Resistance, Bears In Control
Bitcoin price is showing a lot of bearish signs below the $7,280 resistance against the US Dollar. The price is likely to face resistance and selling interest near the $7,280 and $7,400 levels. There is a short term rising channel forming with resistance near $7,290 on the hourly chart of the BTC/USD pair (data feed. дальше »
2019-12-13 09:00 | |
|
|
Bitcoin (BTC) Price Downside Thrust Underway, Bulls Struggling
Bitcoin price failed to stay above the $7,400 support and declined recently against the US Dollar. The price is trading below $7,280 and it could even decline below the $7,160 support. There is a major declining channel forming with resistance near $7,240 on the hourly chart of the BTC/USD pair (data feed from Kraken). дальше »
2019-12-11 09:00 | |
|
|
Ethereum Price (ETH) Near Inflection Point With Bearish Angle
ETH price started a short term upside correction from the $201 low against the US Dollar. Ethereum price is currently trading near the key $215 resistance area and is showing bearish signs. There is a key ascending channel forming with support near $212 on the hourly chart of ETH/USD (data feed via Kraken). дальше »
2019-8-12 06:08 | |
|
|
Ethereum Price (ETH) Remains At Risk Of More Downsides Below $215
ETH price struggled to climb higher and declined below the key $224 support against the US Dollar. Ethereum price is currently trading in a bearish zone and it even tested the $215 support area. There is a major declining channel forming with resistance near $221 on the hourly chart of ETH/USD (data feed via Kraken). дальше »
2019-8-9 06:08 | |
|
|

Bitcoin Price Analysis: BTC Fails To Surpass $12,400 Resistance
Bulls have been well in control of price action over the last few days as price levels rise 18% since the breakout mentioned in my previous analysis on Bitcoin. Bearish signs start have started to show as market price trades below a key resistance level at $12,400. дальше »
2019-8-8 20:54 | |
|
|
Bitcoin (BTC) Price Weekly Forecast: Can Bulls Aim $11.5K?
There was a decent rise in bitcoin price above the $10,500 resistance level against the US Dollar. The price climbed higher and even broke the key $10,650 and $10,800 resistance levels. There is a major ascending channel forming with support at $10,700 on the 4-hours chart of the BTC/USD pair (data feed from Kraken). дальше »
2019-8-4 08:00 | |
|
|
Bitcoin Price (BTC/USD) Correcting Gains, Dips Remain Supported
Bitcoin price climbed higher recently and broke the $10,000 resistance area against the US Dollar. The price retested the $10,200 resistance area and it is currently correcting lower. There was a break below a short term ascending channel with support near $10,020 on the hourly chart of the BTC/USD pair (data feed from Kraken). дальше »
2019-8-1 09:00 | |
|
|
Ethereum Price (ETH) Sighting More Upsides, Bitcoin Breaks $10K
ETH price climbed higher steadily and broke the $215 resistance area against the US Dollar. The price topped near the $220 level and recently corrected below $215. There was a break below an ascending channel with support at $216 on the hourly chart of ETH/USD (data feed via Kraken). дальше »
2019-8-1 06:08 | |
|
|

Bitcoin Holding Support But CME Futures Could Drive Next Move
There has been very little movement on bitcoin price charts over the past couple of days. BTC has found its temporary floor in four figures and the consolidation has continued in a tight range bound channel. дальше »
2019-7-30 18:00 | |
|
|
Ethereum Price (ETH) Spiking Higher But Remains In Downtrend
ETH price declined steadily and recently revisited the $200 support level against the US Dollar. The price traded as low as $197 and spiked sharply above the $200 and $205 levels. There was a break above a short term ascending channel with resistance near $210 on the hourly chart of ETH/USD (data feed via Kraken). дальше »
2019-7-29 06:08 | |
|
|
Ethereum Price (ETH) Correcting Gains, Another Dip Before Higher?
ETH price climbed higher recently above $220 before starting a downside correction against the US Dollar. The price traded as high as $226 and recently declined below the $220 support area. There is a short term declining channel (may be bullish flag) forming with resistance near $218 on the hourly chart of ETH/USD (data feed. дальше »
2019-7-26 06:08 | |
|
|

Ethereum Price Analysis: Bears Struggle To Break $190
Since the 10th of July price levels have broken down out of the ascending channel as mentioned in my previous analysis to key support around $190. Ethereum price looks poised for a reversal at this key level as we near the month of August. дальше »
2019-7-25 18:54 | |
|
|

Bitcoin Price Analysis: Bulls Win Another Breakout
Bitcoin bulls have won yet another descending channel breakout, causing short-term price action to bounce off a key support around $9,500 and push price levels back to 5 digits. Bitcoin Monthly Chart On the monthly XBT/USD, we can see a doji forming on the latest candle as the head sits in the middle of two large wicks. дальше »
2019-7-25 12:22 | |
|
|
Ripple Price (XRP) Starts Fresh Increase Along With Bitcoin & Ethereum
Ripple price remained supported above $0. 3030 and climbed higher against the US dollar. The price broke the key $0. 3150 resistance to move into a positive zone and start a recovery. Yesterday’s highlighted major declining channel was breached with resistance near $0. дальше »
2019-7-25 07:08 | |
|
|
Ripple Price (XRP) Could Extend Losses, Bitcoin Settles Below $10K
Ripple price struggled to recover above the $0. 3250 resistance and extended losses against the US dollar. The price traded below the $0. 3100 support and traded close to the $0. 3025 level. There is a significant declining channel forming with resistance near $0. дальше »
2019-7-24 07:08 | |
|
|

Bitcoin Price Analysis: $9,800 Support Stops Price Freefall
Over the last 3 Days, Bitcoin has dropped around $1,000 forming a tight descending channel. Bears are struggling to gain any momentum as price levels toy with key support around $9,850 as mentioned in my previous analysis. дальше »
2019-7-24 22:22 | |
|
|

Bitcoin Price Analysis: $10,500 Holds Strong Despite Low Volume
Over the last 3 to 4 Days Bitcoin has been trading between $10,400 and $11,000 after the recent breakout of the descending channel on the 18th of July, as shown in my previous analysis. Traders are anxiously awaiting a decision as BTC continues within a tight trading range. дальше »
2019-7-21 17:01 | |
|
|