Новости о Bitcoin Zoom [ Фото новости ] [ Свежие новости ] | |


Bitcoin due to hit $90K 'in coming weeks' despite pullback — latest technical analysis
It's a case of "if in doubt, zoom out" this week, as Bitcoin heads for a showdown with Taproot and ETF approvals.
дальше »2021-11-13 16:25 | |
|
|
What Did Musk, Dorsey, And Wood Say About ESG, Green Energy, And Bitcoin Mining?
The billionaires had a Zoom meeting yesterday, and it’s all crypto Twitter talks about today. Bitcoin should embrace ESG concerns, thinks Cathie Wood. Jack Dorsey hopes Bitcoin will bring world peace. дальше »
2021-7-23 23:58 | |
|
|
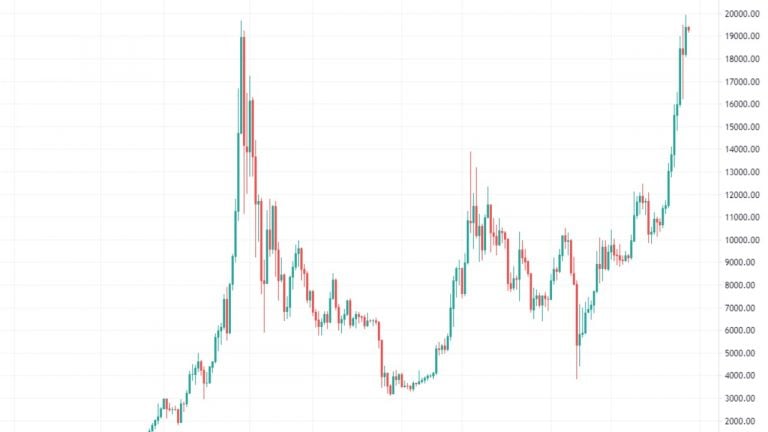
Market Watch by Fyookball: Price Is in a Tight Channel
BTC is often a good macro indicator for the entire crypto market, so this is a good place to start. Bitcoin (BTC) has recently surpassed its all-time high price just shy of $20,000, so it’s a unique time to zoom out and look at the weekly chart for the past several years. дальше »
2020-12-7 15:30 | |
|
|
Investing in Bitcoin – Why and How for Family Offices (Online Talk by Simon Peters, Decus Network)
Investing in Bitcoin – Why and How for Family Offices SPEAKER Simon Peters (Decus Network) DATE & TIME Date: Tuesday, August 04, 2020 Time: 9h00-9h45 Mode: online talk via Zoom; Zoom dial-in URL will be sent previous to the online talk WHY DO WE DO ONLINE TALKS? CORONA. дальше »
2020-7-1 18:54 | |
|
|

Bitcoin Might Keep Lights on For Paper Causing a Stir in Austria
High politics, bitcoin, drugs, parties, Europe’s youngest leader, allegations or defamation, an election and a collapsed government. It has it all, beginning with a “paper,” Zoom Institute, that seemingly came. дальше »
2019-7-29 18:12 | |
|
|

Op Ed: Lightning Network Consensus Is a Marketplace and That’s Okay!
To Bitcoin or Not to BitcoinDuring the “scaling debate” before the SegWit2X user-activated soft fork (UASF), Bitcoin businesses were getting their first bitter taste of Bitcoin’s censorship resistance. дальше »
2019-5-21 21:10 | |
|
|
Bitcoin Weekly Chart – What is BTC Telling Us?
GREEN CANDLES! When moon? We’re going to $10,000 now! Just some of the terms you see flying about in the crypto community the past week via various social media platforms. But if we just take a step back and zoom out, what is the Bitcoin weekly candle signaling or hinting? I always like to analyze […] The post Bitcoin Weekly Chart – What is BTC Telling Us? appeared first on ZyCrypto. дальше »
2019-4-7 11:45 | |
|
|

Bitcoin Price Analysis: Low Time Frames Show Signs of Life Amid Weekly Tests
Bitcoin continues to coil tightly within its range-bound market as the bulls and bears fight it out to see which is most dominant. On the lower time frames (TF), bitcoin is managing to find support:Figure 1: BTC-USD, 2-Hour Candles, Low TF SupportThe zone outlined by the green line in Figure 1 represents local support that has kept the market afloat for the last week and a half. дальше »
2019-3-13 22:26 | |
|
|

Bitcoin Price Analysis: Strong Rally Tests Overhanging Resistance
Earlier this week, bitcoin enjoyed a strong and quick rally, spanning all the way from the low $3,100s to the upper $3,900s — in other words, a move that previously took the market weeks to make, this time took place in just a few short days. дальше »
2018-12-20 02:21 | |
|
|

Bitcoin Isn’t Volatile – the World Is
It’s been a horrible year for cryptocurrency. Assets down an average of 90 percent, constant despair and each new day bringing fresh horror. Who’d want to be a bitcoin trader? But when you zoom out beyond the cryptosphere to gain some perspective, it turns out that crypto’s not doing so badly after all. дальше »
2018-11-21 17:30 | |
|
|
Bitcoin Price Analysis: Shaky Support Gives Way to Massive Bear Flag Set-up
A sideways market has many bitcoin investors wondering if the downward volatility has finally subsided. As stated in our previous discussion of the bitcoin market, the $6,425 support level was a very important level to hold. дальше »
2018-6-22 00:12 | |
|
|
Bitcoin Price Analysis: Breakdown of Consolidation Tests Bullish Resolve
In the previous BTC-USD market analysis, we discussed a macro pattern forming, called a “symmetrical triangle. ” A symmetrical triangle (shown in red) is a directionally agnostic consolidation pattern. дальше »
2018-6-13 00:05 | |
|
|