Новости о Area Resistance [ Фото новости ] [ Свежие новости ] | |

Bitcoin Price Weekly Analysis: BTC Signaling Bullish Continuation, $4K Incoming?
Bitcoin price started a downside correction after a sharp move towards $3,750 against the US Dollar. The price corrected lower and tested the $3,540-3,530 support area, where buyers emerged. Later, there was a break above a key bullish flag with resistance near $3,570 on the 4-hours chart of the BTC/USD pair (data feed from Kraken). дальше »
2019-2-17 09:00 | |
|
|
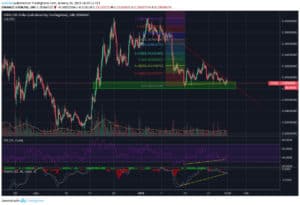
Ethereum Classic Price Prediction: ETC Is Trading Inside the Minor Resistance Area, Will It Break Out?
Long-Term Outlook A look at the weekly chart for ETC shows that price is currently trading between the long-term support and resistance areas which can be found near $3 and $6 respectively. Price is currently trading at $4. дальше »
2019-2-16 16:14 | |
|
|
Stellar Price Prediction: XLM Broke Out From the Short-term Resistance Line, Will It Move Past $0.1?
Long-Term Outlook A look at the logarithmic chart for XLM shows that price is trading at $0. 08, at the edge of the long-term support area formed by the highs of April 2017 and slightly below the 200-period MA. дальше »
2019-2-15 13:00 | |
|
|
Bitcoin Price Watch: BTC Buyers Eye Next Crucial Bullish Break
Bitcoin price dived with bearish moves and retested the key $3,540 support area against the US Dollar. There is a crucial declining channel in place with resistance at $3,585 on the hourly chart of the BTC/USD pair (data feed from Kraken). дальше »
2019-2-15 09:30 | |
|
|
Litecoin Price Prediction: LTC Found Support at the Recent High, Is It Heading for the $48 Top Again?
Long-Term Outlook A look at the Weekly chart for Litecoin shows that the price of LTC/USD has found resistance at the major resistance area formed by previous support near $50, and started a small retracement. дальше »
2019-2-14 14:09 | |
|
|
Bitcoin Price Watch: BTC Set For Further Gains, Downsides Limited
Bitcoin price stayed above the key $3,560 support area, with range moves against the US Dollar. This’s week’s followed bearish trend line is intact with resistance at $3,590 on the hourly chart of the BTC/USD pair (data feed from Kraken). дальше »
2019-2-14 09:00 | |
|
|
Ripple Price Analysis: Upsides In XRP Remain Attractive To Sellers
Ripple price climbed higher, but it failed near the $0. 3100 resistance area against the US dollar. There is a new connecting bullish trend line formed with support at $0. 3000 on the hourly chart of the XRP/USD pair (data source from Kraken). дальше »
2019-2-14 08:00 | |
|
|
TRON Price Prediction: TRX / USD Has Broken Down From a Short Term Triangle Pattern, Where Is the Coin Heading Next?
Long-Term Outlook A look at the weekly chart for TRX shows that the price is currently trading at $0. 024 after retracing from the major resistance area near $0. 03. Price is trading above the 21-period MA but below the 50-period MA, which is offering resistance to price. дальше »
2019-2-13 14:14 | |
|
|
Bitcoin (BTC) Price Analysis: Still Waiting for a Bullish Flag Break
Bitcoin is still treading sideways in a short-term consolidation that looks like a bullish flag pattern. This is around the top of the descending channel visible on the 4-hour time frame, which explains why there is a lot of resistance. дальше »
2019-2-13 06:36 | |
|
|

DASH Price Prediction: Price Breaks Out Above Resistance, Next Resistance at the 100-Day MA?
Long-Term Outlook A look at the Dash Weekly chart in logarithmic form shows that price briefly traded inside the support area at $45-$55, before starting an upward move and is now trading at $80. дальше »
2019-2-11 16:24 | |
|
|
TRON Price Prediction: Did TRX Just Break Down From the Support Line of the Triangle?
Long-Term Outlook A look at the Weekly chart for TRX shows that price is trading at $0. 026, slightly below the main resistance area near $0. 03. The current weekly candle is an inverted hammer, which when found in an uptrend usually signifies a reversal. дальше »
2019-2-10 17:00 | |
|
|

XRP Price Prediction: We Broke Out of the Descending Wedge, Where Is Price Heading to Next?
Long-Term Outlook A look at the Weekly chart for XRP shows that price is at the edge of the $0. 26-$0. 28 support area. If the support area fails to hold, the next one will be found near $0. 15. дальше »
2019-2-9 19:44 | |
|
|

One Trader Thinks Recent 10% Rally of Bitcoin Could Lead to Something Much Greater: a Full-Fledged Recovery
The Bitcoin price today chartered into positive territory after weeks of bearish action near $3,400. It rose close to 10% while clearing through a stubborn resistance area of $3,480-3,500. A sudden spike is as incredible as it is scary. дальше »
2019-2-9 23:00 | |
|
|
Bitcoin (BTC) Price Analysis: Will This Trend Resume?
Bitcoin seems to have completed its pullback to the area of interest at the $3,460 area and could be ready to resume its slide. Price might aim for the Fibonacci retracement levels next. The 100 SMA is still below the longer-term 200 SMA to indicate that the path of least resistance is to the downside. дальше »
2019-2-8 06:53 | |
|
|
Tron [TRX] Price Prediction: Approaching the End of the Symmetrical Triangle, When Will the Breakdown Occur?
Long-Term Outlook A look at the Weekly chart shows that TRX has been following a descending support line since February 2019. Price was rejected for the third time in the resistance area of $0. 028-$0. дальше »
2019-2-7 16:09 | |
|
|
Crypto Market Update: Binance Coin (BNB), Bitcoin SV, Tron (TRX), ADA Price Analysis
The total crypto market cap recovered recently, but it could struggle near the $108. 50B resistance. Binance coin (BNB) extended gains and traded above the $8. 00 resistance. Bitcoin SV price gained more than 8% and broke the $60. дальше »
2019-2-7 09:00 | |
|
|
Ripple Price Analysis: XRP Remains Sell On Rallies Towards $0.30
Ripple price extended losses and tested the $0. 2840-0. 2850 support area against the US dollar. There is a major bearish trend line in place with resistance near $0. 2920 on the hourly chart of the XRP/USD pair (data source from Kraken). дальше »
2019-2-7 08:00 | |
|
|
Binance Coin [BNB] Price Prediction: Does the Bearish Divergence Mean That We Just Made a Double Top?
Long-Term Outlook A look at the Weekly chart for BNB in logarithmic form shows that price is trading at $7, very close to the 7-period MA and the previous resistance area at $7. 5-$8. 5. The nearest support area can be found at $4. дальше »
2019-2-5 14:39 | |
|
|
Ethereum Price Analysis: ETH Continues To Bleed Below $108
ETH price struggled to settle above the $108 resistance area and declined recently against the US Dollar. There was a break below a key bullish trend line with support at $106 on the hourly chart of ETH/USD (data feed via Kraken). дальше »
2019-2-4 07:08 | |
|
|
Ethereum Price Prediction: Did We Reach the Bottom or Is There Another Drop in Store?
Long-Term Outlook: A look at the Weekly chart for Ethereum in logarithmic form shows that after breaking down through the $180 support, the price is trading at $109, below the 7,21,50 period moving averages and the Ichimoku cloud. дальше »
2019-2-3 16:44 | |
|
|
Litecoin [LTC] Price Prediction: Will the Third Attempt Be Successful at Breaking Through Resistance?
Long-Term Outlook A look at the Weekly chart for Litecoin in logarithmic form shows that price has fallen all the way to the support area formed by the highs of 2014 at $25-$30. Price is currently trading at $33. дальше »
2019-2-2 20:09 | |
|
|
XRP, Dogecoin, XLM, IOTA, Monero, Dash, Neo, Tron: Price Predictions, Feb 2
XRP Price Analysis: A look at the Daily chart for XRP shows that price is very close to the $0. 26-$0. 28 support area, currently trading at $0. 31. Price is trading below the 7, 21, 50 and 200-period moving averages and the Ichimoku cloud and is facing very close resistance from the 7-period MA. дальше »
2019-2-2 16:34 | |
|
|
Tron Price Prediction: The Second Attempt at Breaking Resistance Was Unsuccessful, Will Price Break Through on the Third One?
Long-Term Outlook A look at the Weekly chart for Tron shows that price is following a descending support line. Price is currently trading at $0. 026, slightly below the resistance area of $0. 028-$0. дальше »
2019-2-1 14:04 | |
|
|
IOTA Price Prediction: Finally Arriving at the Breakout of the Wedge
Long-Term Outlook A look at the Weekly chart for IOTA in logarithmic form shows that price touched the resistance area at $0. 18-$0. 22 and immediately started an upward move to the next resistance area at $0. дальше »
2019-1-30 18:04 | |
|
|
Litecoin [LTC] Price Prediction: Will the Third Attempt at Breaking Resistance Be Successful?
Long-Term Outlook A look at the Weekly chart for Litecoin in logarithmic form shows that the price is very close to the support area of $25-$30 formed by the highs of 2014, currently trading at $32. дальше »
2019-1-30 17:24 | |
|
|
Ethereum Price Analysis: ETH In Trouble, Risk of Breakdown Below $100
ETH price failed to bounce back and declined below the $108 and $104 supports against the US Dollar. Yesterday’s highlighted key bearish trend line is intact with resistance at $110 on the hourly chart of ETH/USD (data feed via Kraken). дальше »
2019-1-29 07:08 | |
|
|
Bitcoin (BTC) Price Analysis: Channel Support Bounce, Next Targets
Bitcoin found support at the bottom of its descending channel on the 1-hour time frame and looks due for a pullback to the top. Applying the Fibonacci retracement tool shows the next potential resistance levels. дальше »
2019-1-29 04:16 | |
|
|
Tron Price Action: TRX Moves Back Below Key Level Amid Bearish Market Movements
After several tests last week, Tron made a move above a key resistance level at $0. 028. $0. 028 to $0. 031 was a key area of consolidation for Tron during bearish market drops in August, and the price quickly found liquidity and moved to $0. дальше »
2019-1-28 18:19 | |
|
|
Ripple Price Analysis: XRP Could Accelerate Losses Below $0.3000
Ripple price declined recently and broke the $0. 3100 and $0. 3070 supports against the US dollar. There is a major bearish trend line in place with resistance at $0. 3030 on the hourly chart of the XRP/USD pair (data source from Kraken). дальше »
2019-1-28 08:00 | |
|
|
Bitcoin (BTC) Price Analysis: Can Support Still Hold?
Bitcoin suffered another leg lower and is down to the very bottom of its broadening wedge formation once more. A bounce off this area could still keep it on track towards testing the resistance, but a break lower could spur further declines. дальше »
2019-1-28 07:42 | |
|
|
Tron Price Prediction – Will TRX Break Through the $0.032 Area of Resistance?
A look at the 6-hour chart for TRX shows that price touched the $0. 030-$0. 032 area of resistance before retracing a small amount. Price is currently trading at $0. 00298. The RSI is at 75, indicating overbought conditions, but there are no signs of bearish divergence yet. дальше »
2019-1-27 20:24 | |
|
|
Tron Price Action – TRX Continues Bullish Movements with Higher High
The price of Tron has continued its bullish movements today as it continued to form a higher high. Price met resistance at $0. 031 after just surpassing the resistance level at $0. 028 yesterday. дальше »
2019-1-27 17:44 | |
|
|
Bitcoin Price Weekly Analysis: BTC Trading Near Make-or-Break Levels
Bitcoin price is trading nicely above the $3,500 support area against the US Dollar. There is a major ascending channel formed with resistance at $3,650 on the 4-hours chart of the BTC/USD pair (data feed from Kraken). дальше »
2019-1-27 09:00 | |
|
|
IOTA (MIOTA) Long-term Price forecast- January 26
IOT/USD Long-term Trend -Bearish Supply zone: $0. 6000, $0. 7000, $0. 8000 Demand zone: $0. 1000 $0. 0800, $0. 0600 IOTA is in a bearish trend in the long-term outlook. The bullish pressure was lost after a nice ride to $0. дальше »
2019-1-27 00:14 | |
|
|
TRON Price Prediction: How Long Will TRX Continue the Rally?
Long-Term Outlook A look at the Weekly chart for TRX shows that price is following a descending support line. After bouncing in December, the price has moved past the 7-period moving average and is now headed for the $0. дальше »
2019-1-26 20:49 | |
|
|
Price Predictions for the Top 5 Penny Cryptocurrencies: XRP, XLM, TRX, ADA & IOTA
XRP Price Prediction and Analysis: A look at the Weekly chart for XRP shows that price is very close to the major support area at $0. 30. Price is trading below the 7 and 21 period moving averages. дальше »
2019-1-26 17:09 | |
|
|

Litecoin [LTC] Price Prediction: Did We Reach a Bottom at $25?
Long-Term Outlook A look at the Weekly chart for Litecoin in logarithmic form shows that after falling to the major support area at $23-$26, the price promptly reversed with an upward move towards the 200-period Moving Average. дальше »
2019-1-25 15:14 | |
|
|
Ripple Price Analysis: XRP Trading Sideways Below Key Resistance
Ripple price corrected lower and tested the $0. 3130 support area against the US dollar. There was a break above a key declining channel with resistance at $0. 3145 on the hourly chart of the XRP/USD pair (data source from Kraken). дальше »
2019-1-25 08:00 | |
|
|
Ethereum Price Analysis: ETH Relatively Muted, Next Move Finally Coming?
ETH price revisited the $114 support area and later moved higher against the US Dollar. Yesterday’s highlighted declining channel is intact with resistance near $117 on the hourly chart of ETH/USD (data feed via Kraken). дальше »
2019-1-25 07:08 | |
|
|
Tron Price Analysis: TRX Meets Resistance After Recent Uptrend
After outperforming most top cryptocurrencies recently, Tron has found resistance at $0. 028. Tron has been performing a series of higher highs and higher lows recently but has stopped its increase but has halted its appreciation as it approaches $0. дальше »
2019-1-24 18:29 | |
|
|
Ethereum Price Analysis: ETH Remains A Sell Until It Breaks $120
ETH price tested the $119-120 resistance area and failed to gain strength against the US Dollar. There is a short term declining channel formed with resistance near $118 on the hourly chart of ETH/USD (data feed via Kraken). дальше »
2019-1-24 07:08 | |
|
|
Bitcoin (BTC) Price Analysis: More Downside Targets?
Bitcoin recently broke below a short-term rising trend line to signal that bearish pressure was very much in play. Price bounced off support around the $3,500 area but this seems to be a mere pullback from the breakdown. дальше »
2019-1-24 05:42 | |
|
|
Dogecoin Price Prediction: DOGE Is at the Lower Range of the Support Area, When Will It Start a Rally?
Long-Term Outlook A look at the Weekly chart for Dogecoin shows that price has fallen to the long-standing support area at $0. 002, which coincides with the 200-period moving average. Furthermore, the MACD is starting to turn and is getting ready to make a bullish cross. дальше »
2019-1-23 17:14 | |
|
|
Ethereum Price Analysis: ETH Staging Decent Comeback, Could Test $125
ETH price tested the $110-111 support area and later bounced back above $116 against the US Dollar. This week’s followed key bearish trend line was breached with resistance at $118 on the hourly chart of ETH/USD (data feed via Kraken). дальше »
2019-1-23 07:08 | |
|
|
XRP Price Prediction: Approaching the End of the Symmetrical Triangle
Long-Term Outlook A look at the Weekly chart for XRP shows that price is currently trading at $0. 32, close to the long-standing support area at $0. 3. Price is facing very close resistance from the 7-period moving average and is also below the Ichimoku cloud. дальше »
2019-1-22 15:04 | |
|
|
Ethereum Price Analysis: ETH Consolidating Below Crucial Barriers
ETH price declined recently below $120 and tested the key $112 support area against the US Dollar. Yesterday’s highlighted important bearish trend line is intact with resistance at $118 on the hourly chart of ETH/USD (data feed via Kraken). дальше »
2019-1-22 07:08 | |
|
|
Tron Price Prediction: TRX Is Trying to Break Out of a Symmetrical Triangle
Long-Term Outlook: A look at the 3-day chart for TRX shows that price met resistance at the original support area at $0. 032-0. 035, which coincides with the Ichimoku Cloud and the 50-Period Moving averages. дальше »
2019-1-21 17:14 | |
|
|
IOTA Price Prediction: Are We Done Retracing or Is Another Drop in Store?
Long-Term Outlook A look at the Weekly chart for IOTA in logarithmic form shows that price fell to the main resistance area at $0. 21-0. 23. Afterward, price started a small rally until the first resistance area at $0. дальше »
2019-1-18 14:19 | |
|
|
Bitcoin Price Watch: BTC Signaling Decent Comeback Above $3,700
Bitcoin price declined again and tested the $3,550 support area before recovering against the US Dollar. There was a break above a major bearish trend line with resistance at $3,585 on the hourly chart of the BTC/USD pair (data feed from Kraken). дальше »
2019-1-18 09:45 | |
|
|